LITECOIN: willing to break the 200DMA

For those who maybe missed my previous post about LITECOIN lately, just tell you that in my opinion there is no other big crypto showing better indications of REVERSAL than LITECOIN.

Actually, Friday’s BITCOIN rise was first leaded or noted by LITECOIN. LITECOIN showed the path and the whole market follow the trend.

Today, LITECOIN seems to resume the upwards trend.

Looking for a feasible EW-count we may have the following scenario:

Assuming the last rise as a (iii)rd wave, LTC seems resuming the movement upwards, building now the (v)th, everything ascribed within a 3rd bigger wave.

Conservatively, if we assume that waves 1

Bitcoin – Fib levels

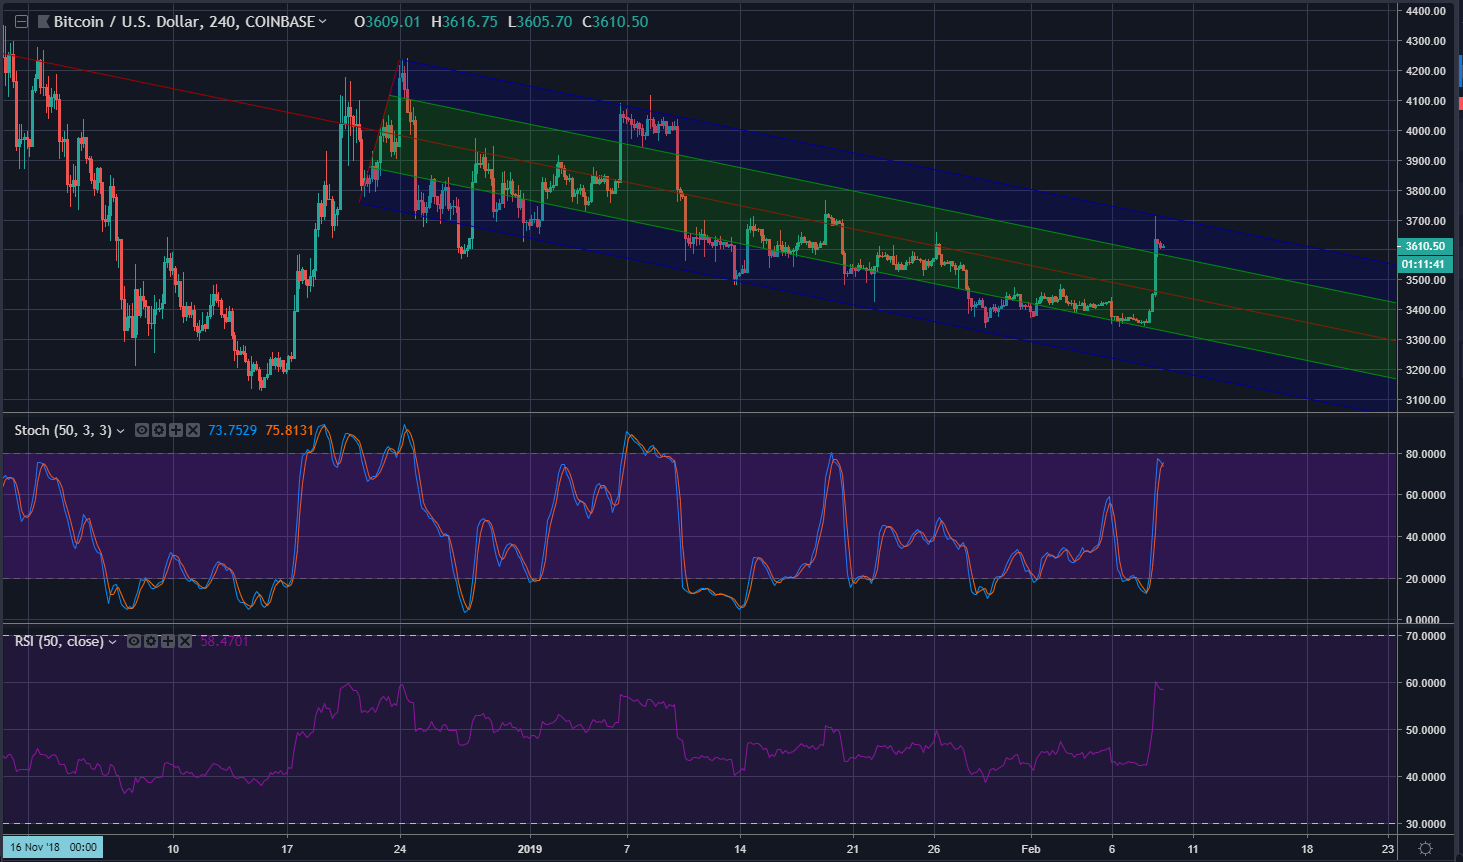
I have complained over and over again about the tricky 2019 Fib levels. Well I went out and did something about it – I found them.

Yesterday I made it very clear that BTC was in a channel and that it should be viewed diagonally to make sense of it:

“Hear me clearly when I say this: BTC is not using horizontal support and resistance levels at the moment; it is using diagonal ones.“

That post dealt with a broad channel. Today I want to dig a little deeper into the levels. I want to show them to you.

I actually found the levels some

Bitcoin Technical Analysis: BULLS HANG ON…FOR NOW

Bitcoin has managed to hold onto most of it’s gains over the past 3 days. As of writing this, $3,600 is acting as support once again. Volume has slowly dropped off as many are waiting to see if this was a bull trap. Looking at the daily chart, we can see price found resistance right…
Read on Trybe

Bitcoin Technical Analysis: BULLS HANG ON…FOR NOW

Bitcoin has managed to hold onto most of it’s gains over the past 3 days. As of writing this, $3,600 is acting as support once again. Volume has slowly dropped off as many are waiting to see if this was a bull trap.

Looking at the daily chart, we can see price found resistance right at the upper Bollinger band. This corresponded almost perfectly with the 50 day MA (Orange line). A decisive break about the 50 day MA (on the daily chart) would be significant IMO.

Long positions remain stacked while shorts have fallen off significantly. This low volume market makes

BITCOIN: That jump of yesterday has been good but…

…obviously still not sufficient.

Frankly, I have doubts about if yesterday’s rise can be ascribed in any Elliot-wave count actually…but it can, of course…

First Option: EXTENDED FIRST WAVE

Let’s say that BITCOIN has traced an EXTENDED FIRST WAVE.

In this case, the first wave is the longest wave in 5-wave cycle upwards, it is completed and now is tracing the second wave, a corrective one.

We know that, in EW terms, under this scenario, the third wave cannot be longer than the first but neither can be the shortest wave. And so, the 5th and last wave upwards MUST be the

BTC – Trade the channel

What caused the spike in crypto prices yesterday? ETF approval rumours?

No – I did.

I’ve mentioned before that I and I alone am the ultimate controller of BTC price. This was once again evidenced yesterday. You see: it’s been a very long time since I’ve had any fiat available with which to buy crypto. In a way that’s a good thing, it’s kept me from buying several dips which were above the $6k level.

Yesterday that changed. I woke up to a long-awaited payment in my bank account. Like a good crypto investor, I decided to use some of it to

Bitcoin, EOS, Ethereum and Ripple Analysis: BREAKOUT

Bitcoin has been consolidating within a falling wedge these past couple weeks. Today it broke out of that wedge with a nice increase in volume behind it. Volume is no where near where it needs to be for a sustainable bull run, but that’s not to say it can’t get there.

EOS broke above the known $2.45 resistance. The next major area of resistance is $3.00. If it can remain above at least $2.70 today, it could be a sign this bullish move has legs.

Ethereum bounced nicely off the known $100 phycological support. It’s currently trading around $118. The next major

4th of July fireworks?

I swear that date is coincidental – though I’ll be that first to admit that it is conveniently useful!

From https://pixabay.com/en/new-year-s-eve-fireworks-beacon-1953253/ ; by nickgesell

First things first

I’m laying my bull flag theory to rest. It was nice while it lasted, but that “flag” has now become far too long, too tapered and too low down relative to the “flagpole” which preceded it. Ergo – it isn’t a bull flag. This means that the post “BTC 29 Jan – still on track” is now invalid.

BTC may have been on track, but now it’s derailed. It is still in the same channel (previously called

Bitcoin, EOS, ETH and Ripple Analysis: QUICK UPDATE

Bitcoin has broken below the $3,400 support, currently trading around $3,365 on Coinbase. Volume remains weak.

EOS seems unable to break above the $2.45 resistance, currently trading at $2.36 on Bitfinex.

Ethereum continues to bounce right above the psychological support of $100 on Coinbase.

Ripple is still operating within a falling wedge, currently trading around $0.29 on Bitfinex.

In today’s video analysis I discuss, where prices may be heading next, various trade setups I’m waiting on and so much more. I hope you find it helpful.
Video Analysis:


If you don’t see the above video, navigate to TIMM (https://mentormarket.io/workin/) or Steemit in order to watch.

I hope

LITECOIN: Possibly the most Bullish Big Crypto out there nowadays

Very little has been said about LITECOIN lately.

Everybody is focused on BITCOIN as the crypto King and maybe we are losing a little bit perspective on valuable and similar other cryptos as can be LITECOIN in this case.

The Daily Chart is very consistent. Oppositely to BITCOIN, Litecoin has been formed a long Trading channel, between two perfect lines, downwards of course, but they have never been broken during this long correction.

Nowadays, while BITCOIN is moving in a hesitant manner LITECOIN has performed very well, steadily and even upwards…

Supported by the 50 Moving Average which shows as well a sort of