Buy crypto now! – Like this:

Crypto is dirt cheap. 

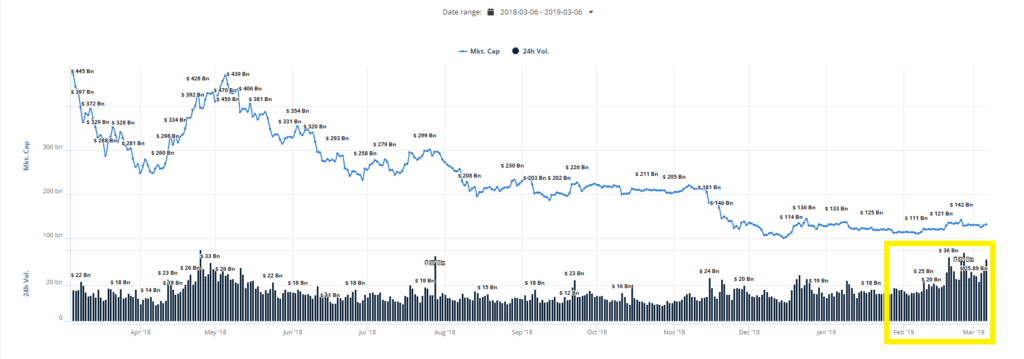
Volume continues to climb steadily (since May last year – as shown at the end of this post from yesterday). Capitulation happened four months ago.  Yes folks, “capitulation” is what you call it when an asset like BTC sheds 85% of its value. To those who still expect “lower lows” – I just shake my head. An 85% drop wasn’t enough for you? How about some other cryptos then? My $195 NEO became $5.50 NEO. That’s a 97% drop – and STILL you want “lower lows” before investing? 

Get REAL!

I’m buying in. I think this is a great opportunity and I’m making the most of

$EOS Intermediate Analysis

If you have followed me you know that I am big on the EOS train. The run up to $26 was real, and the crash and burn dip to $2 is also real. I am scooping up every chance I get at these levels. Let’s take a look at what we look like now….

BULLISH!

You can see the spike and puke on an intermediate timeframe and watch how the asset goes sideways from that point. Then you have the shakeout that all of crypto had that I called a week ago and now we have grinded higher. AS LONG AS WE

Hello Volume My Old Friend

https://coinmarketcap.com/

Well that’s a little bit interesting now, isn’t it? A $10 billion volume day for Bitcoin. A flash in the pan, perhaps. Almost 2.4 billion for EOS.

https://coincheckup.com/global

Zooming out to the 30-day global chart there’s been a clear uptick in volume.

https://coincheckup.com/global

Zooming out further to the one year chart we can clearly see a recent return of volume over the last few weeks.

https://coinmarketcap.com/currencies/volume/monthly/

The top cryptos are beginning to show a return to impressive volume numbers.

https://coinmarketcap.com/historical/20180304/

Today’s numbers far exceed this time last year.

What’s it All Mean?

Does this mean we are going to the moon? No. 

Could we go lower? Yes. 

A lot lower? Yes. 

But would we

Crypto Contest March 6: Kore

Kore (Bittrex: KOREUSD) has broken out of the triangle pattern in the weekly chart.

(Chart courtesy of Tradingview.com (log scale))

Elliott Wave Analysis

In Elliott Wave terms, Kore began a wave one advance in August 2015. The red wave one (blue sub-waves i-ii-iii-iv-v) finished in January 2018, and the red wave two (blue sub-waves a-b-c) correction ended in December 2018. If this wave count is correct, Kore should be heading next towards the January 2018 peak in the red wave three.

(Chart courtesy of Tradingview.com (log scale))

Funnymentals

Kore promotes transactional anonymity for financial transactions as well as phone calls, web surfing, a cross platform operating

Recap of Crypto Chart Reviews on the Scaredy Cat Investor Show

Today on the scaredy cat investor show we reviewed the price charts of steem, litecoin and bitcoin.
Let’s recap what was covered and the outlook we came too.
Relative Strength
Litecoin is showing the most strength among the three and possibly among all crypto.

Looking at the litecoin chart you can see several good things happening:

Price broke the 200 day moving average and then confirmed the breakout with a test before moving higher again.
We are now testing the resistance in that $50-51 area after making a higher low.
The upside potential is large if price establishes above the $51 are as the next true resistance

BNB, LTC and EOS: three major cryptos leading the rise

I have been talked about this 3 cryptos since weeks ago already.

These three are the most bullish cryptos right now among the major ones.

Their approach to the “GOLDEN CROSS” or the cross of the 50 Day Moving Average through the 200 Day Moving Average was so clear to happen in the short time that I already estimated the dates for this event to happen just by extrapolating both trends.

In the case of BINANCE COIN [BNB], It accomplished the prediction as I expected on March the third:

BINANCE may have completed already 5th wave up and so, the 1st big wave

Bitcoin Technical Analysis: QUICK UPDATE

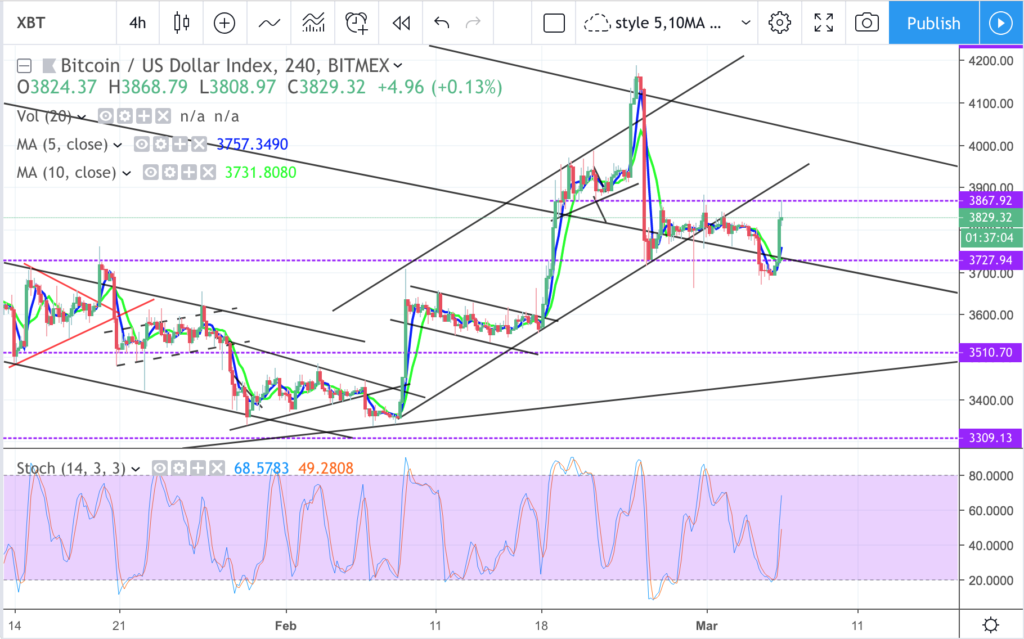
In yesterdays video we discussed why I felt price would climb back up to around $3,800 in the short term. Today bitcoin did spike just above $3,800, and is currently trading around $3,835. This move came with a nice increase in volume.

In today’s video analysis I discuss where price may go from here, key areas to watch and so much more. I hope you find it helpful.

Video Analysis:

If you don’t see the above video, navigate to TIMM (https://mentormarket.io/workin/) or Steemit in order to watch.

I hope this has been helpful. I’d be happy to answer any questions in the comment section

BITCOIN – 5 Mar

And we have the bounce up, some space breather for the down move to test triangle bottom. On daily possible consolidation between 3800~3700 forming a mini triangle.
On weekly, if we can test 4000 again and close the weekly above then the following week maybe maybe maybe a good test for breakout upside. Gut feel likely fake and maybe fake breakout (if there’s one) then back again. Still early.
News: (Current) | (Upcoming)
Short term moving average (day candle) :
RSI :
Network Value to Transactions Ratio :116
Total marketcap :132
Dominance :51.8
Bitfinex Margin Long/Short Volume Ratio :
Depth Chart : (S) | (R)
Weekly Timeframe :

Crypto – return of the contrarian indicator markets?

Read carefully, If I’m right about this then it’s big news.

As an asset class, cryptocurrencies have yet to establish their independence. They have yet to prove themselves to the markets of the world. I think that the time for crypto to gain serious recognition and credibility in the eyes of the world may be upon us.

For the purpose of this article I’m going to use Bitcoin as a representative of cryptocurrencies as a whole.

History

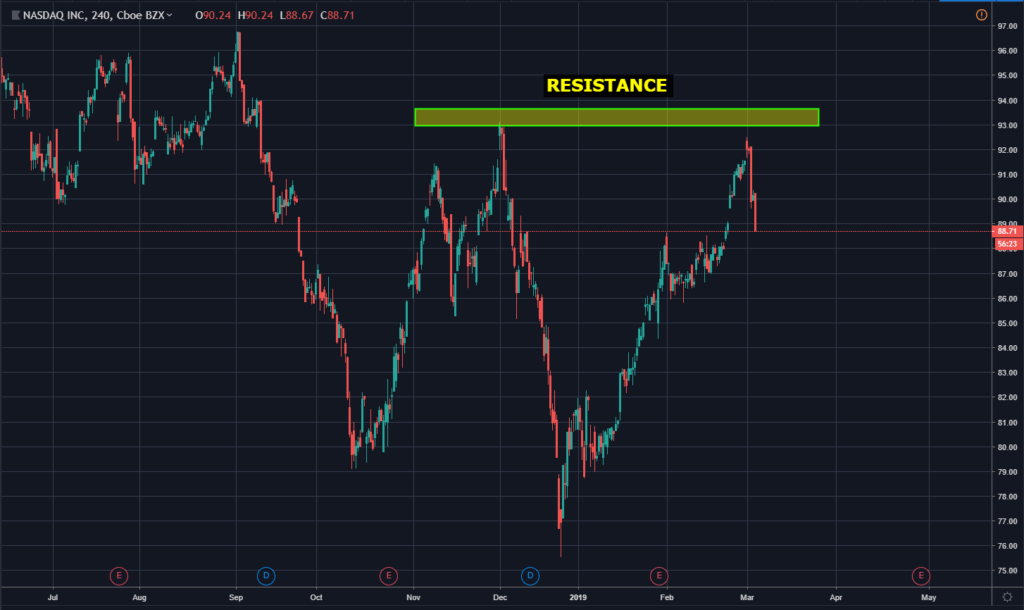
In the past BTC has tracked the movements of the major stock market indicators. After studying this phenomenon for some time, I found that it seems to

I mentioned yesterday… $LTC Litecoin will lead!

Litecoin is rocketing higher after holding above the 200 day MA here this morning. I mentioned yesterday that LTC may be A LEADER. Not THE LEADER, but A LEADER.

This morning it is CLEARLY the leader across the crypto board regarding % increase in the rankings. The chart looked the best as LTC was holding much higher gains compared to the others and it is showing this relative strength right now.

Don’t sit around and wait…the train is leaving the station baby!