$SPX has hit the 200 day MA…

Over the past couple weeks with buyers stretching the tape to the upside it appeared that this 200 day tap was inevitable. In fact the Dow and SPX have both touched the 200 day and I expect the NDX to do this sometimes this week. One cannot dent that it appears this rally is pressing upwards until the shorts get squeezed and the fund managers have to chase. This is now 8 straight green candles on the SPY chart and many are on the sidelines (Including myself). This rally did not let anyone in.

So what now? With this extension we

Bitcoin Technical Analysis: QUICK UPDATE

Bitcoin broke below the $3,600 support (on Coinbase). It’s now testing the prior order block between $3,580 and $3,540. Should this break down decisively (4hr candel opening and closing below), I believe a drop to $3,400 will become likely. Looking at the 4 hour chart, we can see the 8, 21 and 55 day EMA’s…
Read on Trybe

Bitcoin Technical Analysis: QUICK UPDATE

Bitcoin broke below the $3,600 support (on Coinbase). It’s now testing the prior order block between $3,580 and $3,540. Should this break down decisively (4hr candel opening and closing below), I believe a drop to $3,400 will become likely.

Looking at the 4 hour chart, we can see the 8, 21 and 55 day EMA’s are converging with the 50 and 200 day MA. The Bollinger bands are also bottlenecking. This suggests a larger move may be coming in the next 24-48 hours.

In today’s video analysis I discuss where price may be heading next, traps to avoid and so much more.

Playing Both Sides Of Under Armour

Under Armour Inc. will report fourth-quarter financial results pre-market Tuesday. Analysts largely expect the quarterly report and the 2019 forecast to be inline with the forecasts provided at the company’s December 12th investor day in which they disappointed investors by forecasting low-single-digit-sales growth in North America over the next five years.  

But that didn’t stop the stock from rising 17% in January, even received an upgrade from Goldman Sachs on January 22nd with a price target of $28.  However, did the price rise to fast in too short of a span? 

Analysts will be paying close attention to what Under Armour footwear sales and

Playing Both Sides Of Under Armour

Under Armour Inc. will report fourth-quarter financial results pre-market Tuesday. Analysts largely expect the quarterly report and the 2019 forecast to be inline with the forecasts provided at the company’s December 12th investor day in which they disappointed investors by forecasting low-single-digit-sales growth in North America over the next five years.  
But that didn’t stop the stock from rising 17% in January, even received an upgrade from Goldman Sachs on January 22nd with a price target of $28.  However, did the price rise to fast in too short of a span? 
Analysts will be paying close attention to what Under Armour footwear sales and

Crypto Contest February 12: Dash

Dash (Poloniex: DASHBTC) has broken out of the triangle pattern in the weekly chart.

(Chart courtesy of Tradingview.com (log scale))
Elliott Wave Analysis
In Elliott Wave terms, Dash began a wave one advance in November 2015. The red wave one (blue sub-waves i-ii-iii-iv-v) finished in September 2017, and the red wave two (blue sub-waves a-b-c) correction ended in December 2018. If this wave count is correct, Dash should be heading next towards the September 2017 peak in the red wave three.

(Chart courtesy of Tradingview.com (log scale))
Zooming out in the monthly chart, I believe Dash is currently in the red wave three (blue sub-wave

Crypto Contest February 12: Dash

Dash (Poloniex: DASHBTC) has broken out of the triangle pattern in the weekly chart.

(Chart courtesy of Tradingview.com (log scale))
Elliott Wave Analysis
In Elliott Wave terms, Dash began a wave one advance in November 2015. The red wave one (blue sub-waves i-ii-iii-iv-v) finished in September 2017, and the red wave two (blue sub-waves a-b-c) correction ended in December 2018. If this wave count is correct, Dash should be heading next towards the September 2017 peak in the red wave three.

(Chart courtesy of Tradingview.com (log scale))
Zooming out in the monthly chart, I believe Dash is currently in the red wave three (blue sub-wave

Crypto Shopping Cart 12 February

I’ve been shopping (again). I like to publish these posts so that you can see if I follow my own advice or not.

This is a rather interesting shopping excursion…

From http://www.pexels.com

Funding the buys:

I finally have some fiat available for crypto, but as is said in “BTC – Trade the channel” it’s all still sitting on an exchange locked up in buy orders – none of which have triggered yet. Thank you very much recent BTC price spike.

I have no intention of raising the prices of my BTC offers. Yes I am DCAing back into BTC, but it’s a modified DCA

Coloring – Goldenhourphotography

The color in the sky. The sky’s unique fingerprint.


Categorygoldenhourphotography
Camera ~ LensNikon D3400 DSLR ~ 18-55 mm
LocationAustralia

Giveaway ?
2 SBI share. Winner will be chosen randomly after post payout.

Prompt / Theme:  What’s your favorite sunset color? Deep or light orange? Purple?

Rules:
  • No Upvote, No Resteem, No Follow – just your responding comment required to enter.
  • Comment a reply directly to this post within 7 days. A genuine (family friendly) comment responding to the theme / prompt is required.
  • Posted or Commented 5 or more times during the week this post is active.
  • Not be on @cheetah’s blacklist.

Thanks for having a look ?

If you liked this photo follow @kiokizz for more.


BITCOIN

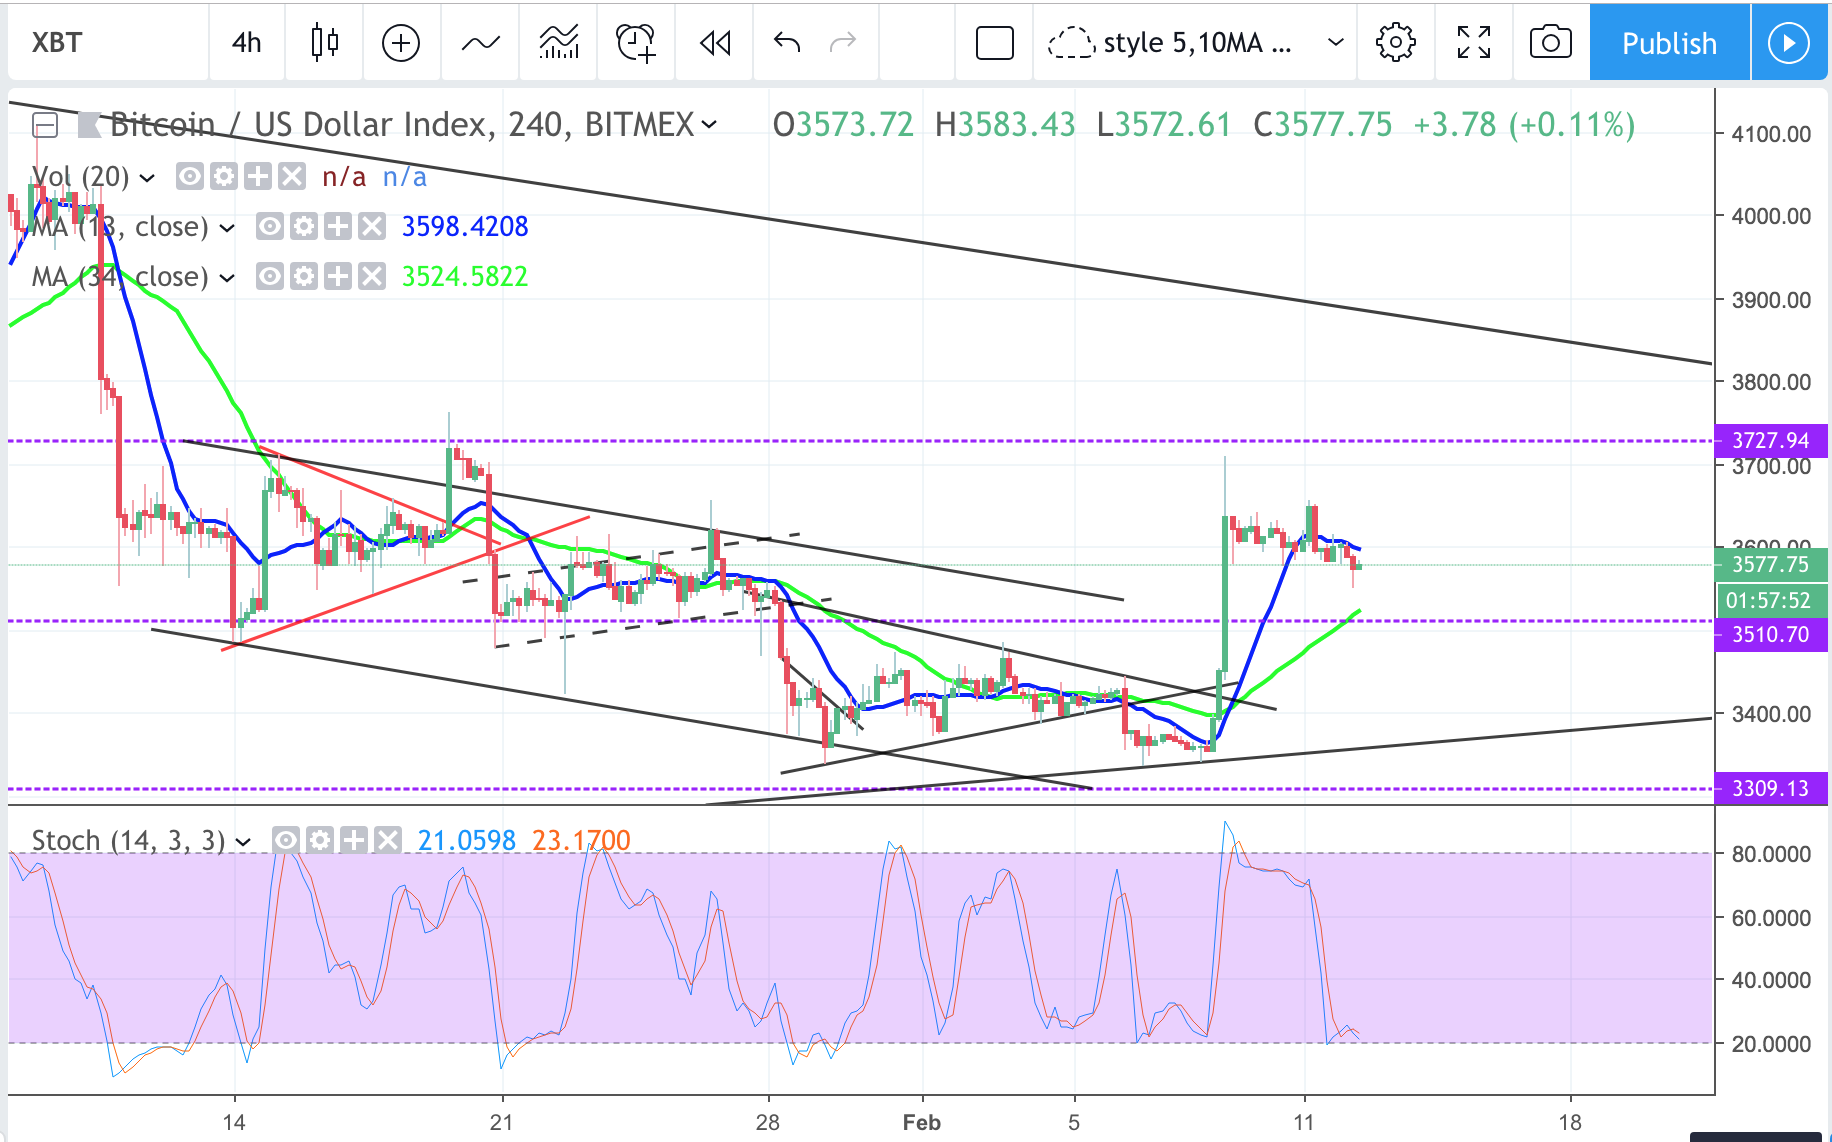
Consolidation to the downside on 4hr chart, towards testing next support 3500 zone. Adjusted the previous triangle bottom, even with a sharp selloff, it might test 3360 triangle bottom first. Still possible for the 2nd leg staircase pattern, upside to test triangle/big channel top around 3800 zone.
News: (Current) | (Upcoming)
Short term moving average (day candle) :
RSI :
Network Value to Transactions Ratio :124
Total marketcap :120
Dominance :52.8
Bitfinex Margin Long/Short Volume Ratio :
Depth Chart : (S) | (R)
Weekly Timeframe :

#### Recommended
►You’re gonna post on instagram, youtube, twitter anyway, why not post and earn steem : https://share2steem.io/
►Walk, Jog, Run and Earn steem for moving