Bitcoin Technical Analysis: BULLS HANG ON…FOR NOW

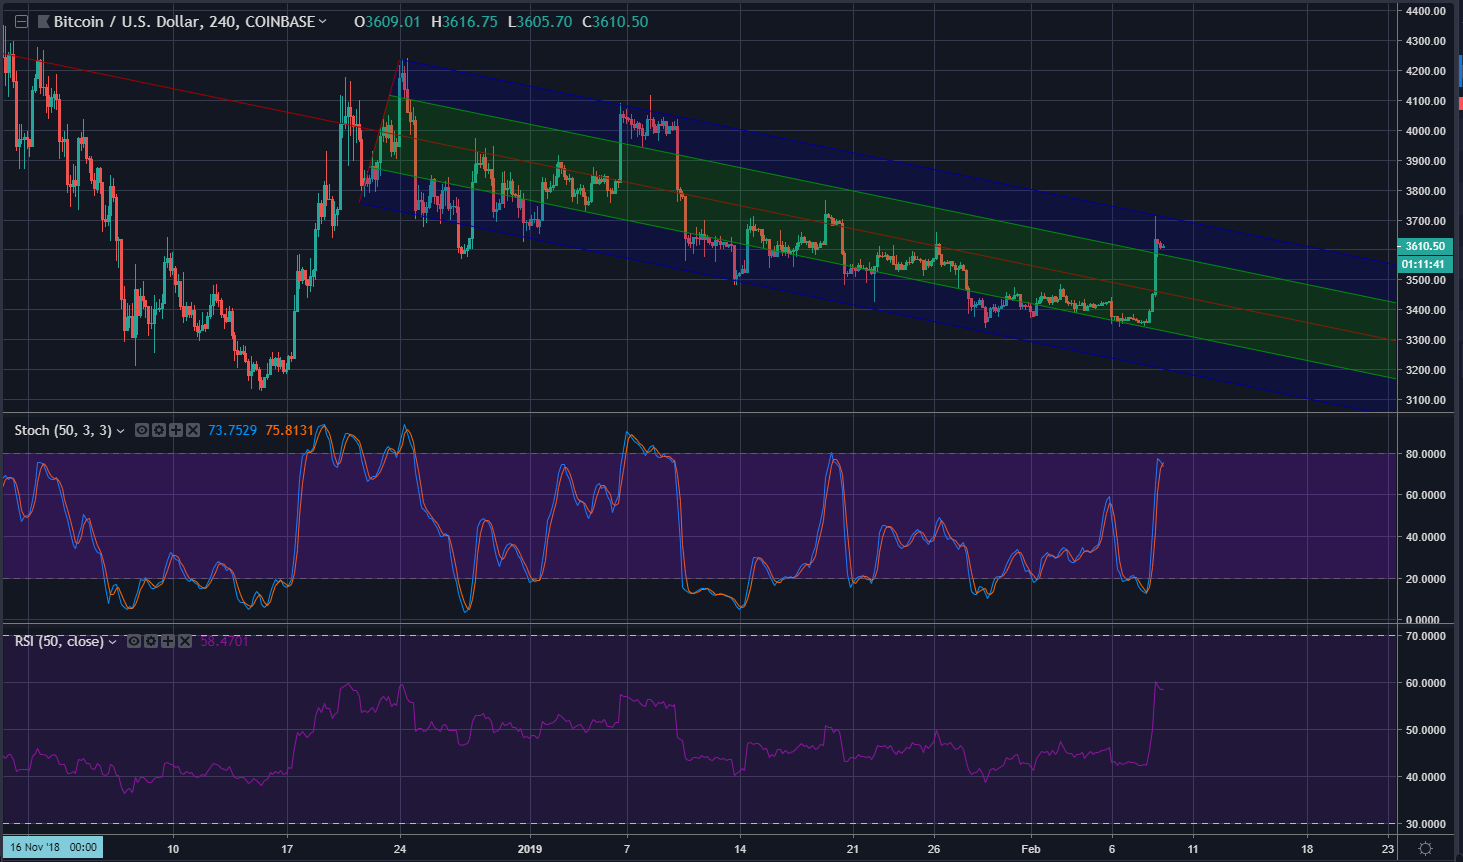
Bitcoin has managed to hold onto most of it’s gains over the past 3 days. As of writing this, $3,600 is acting as support once again. Volume has slowly dropped off as many are waiting to see if this was a bull trap.

Looking at the daily chart, we can see price found resistance right at the upper Bollinger band. This corresponded almost perfectly with the 50 day MA (Orange line). A decisive break about the 50 day MA (on the daily chart) would be significant IMO.

Long positions remain stacked while shorts have fallen off significantly. This low volume market makes

Crypto Contest February 10: UpToken

UpToken (Bittrex: UPBTC) has broken out of the triangle pattern in the four-hour chart.

(Chart courtesy of Tradingview.com (log scale))
Elliott Wave Analysis
In Elliott Wave terms, UpToken began a wave one advance on November 26, 2018. The red wave one finished on December 12, 2018, and the red wave two correction ended on January 10 this year. The red wave three (blue sub-waves i-ii-iii-iv-v) advance finished on January 18, and the red wave four (blue sub-waves a-b-c) correction ended on February 9. If this wave count is correct, UpToken should be heading next towards the January 18 peak in the red wave five.

(Chart courtesy

BITCOIN: That jump of yesterday has been good but…

…obviously still not sufficient.

Frankly, I have doubts about if yesterday’s rise can be ascribed in any Elliot-wave count actually…but it can, of course…

First Option: EXTENDED FIRST WAVE

Let’s say that BITCOIN has traced an EXTENDED FIRST WAVE.

In this case, the first wave is the longest wave in 5-wave cycle upwards, it is completed and now is tracing the second wave, a corrective one.

We know that, in EW terms, under this scenario, the third wave cannot be longer than the first but neither can be the shortest wave. And so, the 5th and last wave upwards MUST be the

What Do We Know From the Chart? $BTC

It has been a grueling 12 months in cryptoland there is no doubt about that. From the top at the end of 2017, you can consistently see lower highs all the way down the chart below. IN FACT, there was NEVER a time that that a higher low even presented itself to me that was “Worth” buying…until now.

After price was pressed down against the 5800 level multiple times, it was only time until it broke. Now that the puke has happened it is then over the past month or so that we should be “watching”. I know you are wondering

Crypto Contest February 9: HyperCash

HyperCash (Binance: HCBTC) has broken out of the triangle pattern in the daily chart.

(Chart courtesy of Tradingview.com (log scale))
Elliott Wave Analysis
In Elliott Wave terms, HyperCash began a wave one advance on December 8, 2018. The red wave one finished on December 18, 2018, and the red wave two correction ended on December 25, 2018. The red wave three (blue sub-waves i-ii-iii-iv-v) advance finished on January 12 this year, and the red wave four (blue sub-waves a-b-c) correction ended on February 1. If this wave count is correct, HyperCash should be heading next towards the January 12 peak in the red

BTC – Trade the channel

What caused the spike in crypto prices yesterday? ETF approval rumours?

No – I did.

I’ve mentioned before that I and I alone am the ultimate controller of BTC price. This was once again evidenced yesterday. You see: it’s been a very long time since I’ve had any fiat available with which to buy crypto. In a way that’s a good thing, it’s kept me from buying several dips which were above the $6k level.

Yesterday that changed. I woke up to a long-awaited payment in my bank account. Like a good crypto investor, I decided to use some of it to

Crypto Rips Higher – $EOS Spikes 17%, $LTC 30%+

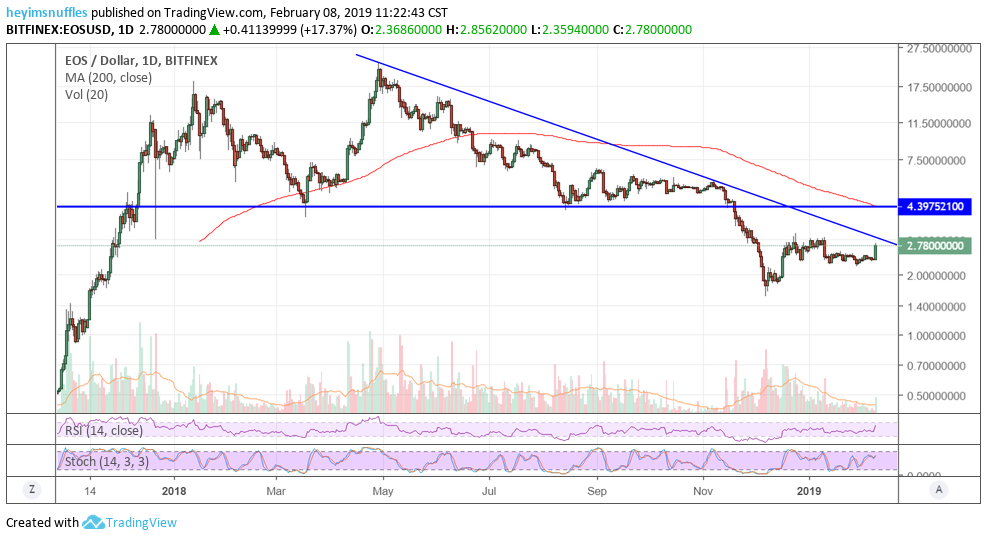
Crypto has awoken. About 2 hours ago after slowly creeping higher and higher, crypto has spiked. EOS and LTC are two that are really ripping higher as they have been the ones that have shown relative strength. Below is the chart of EOS and you can see, if this day holds, this may be quite the igniting bar to start a trend reversal higher in the intermediate term.

Believe me, there is A lot of work left to be done and this work will be done through TIME or PRICE. This is the first step and you can see that taking

Bitcoin, EOS, Ethereum and Ripple Analysis: BREAKOUT

Bitcoin has been consolidating within a falling wedge these past couple weeks. Today it broke out of that wedge with a nice increase in volume behind it. Volume is no where near where it needs to be for a sustainable bull run, but that’s not to say it can’t get there.

EOS broke above the known $2.45 resistance. The next major area of resistance is $3.00. If it can remain above at least $2.70 today, it could be a sign this bullish move has legs.

Ethereum bounced nicely off the known $100 phycological support. It’s currently trading around $118. The next major

Crypto Contest February 8: Ethereum

Ethereum (Kraken: ETHUSD) has broken out of the triangle pattern in the daily chart.

(Chart courtesy of Tradingview.com (log scale))
Elliott Wave Analysis
In Elliott Wave terms, Ether began a wave one advance on December 14, 2018. The red wave one (blue sub-waves i-ii-iii-iv-v) finished on January 5 this year, and the red wave two (blue sub-waves a-b-c) correction ended on February 6. If this wave count is correct, Ether should be heading next towards the January 5 peak in the red wave three.

(Chart courtesy of Tradingview.com (log scale))
Looking at the monthly chart, I believe Ether is currently in the red wave five.