Litecoin Answers Quick as Market Sells Off

Roughly 24 hours ago I did an analysis on litecoin discusses the upside and downside scenarios out there.  Price had been consolidating for a while and a move was bound to happen in the near future – it didn’t take long!

Battle at Support

I mentioned in the downside 108 was a key level (give or tack a point) as it is evident when looking at both the weekly and the daily chart.  Much history at this level of reversals both up and down.

We saw the level come into play earlier today after price puked to 102.  Here is a chart of the hourly price action from the afternoon.  When it finally bounced look where it struggled and then ran out of gas.

Yep right around 108!  Price ended pushing back up against the level and the daily candle closed right up in the mix of it so really the answer of weather support was broken or not is debatable.

However, looking at the weekly chart, where this price support is vital shows that price is already pushing lower again…..

What is crazy is that when you look at weekly candles your “intra-week” highs and lows give you quite the spread.  You can see that 102 and even 98 are intra-week lows that if held is fine if we end the week above 108.  Atleast that is my opinion for LTC to remain bullish.

I’d rather buy 102 and 98 if I get the chance, knowing my downside exit is near, which is why the coin I got at 110 from an open order I forgot I had (doh!) I quickly closed out at 107 for a tiny loss as I want that capital available for purchases at the lower price points if they become available.

Either way, it will be interesting to see how LTC reacts in regard to BTC, which sparked the market sell-off and on the weekly chart has me skeptical about going higher before pulling back a bit more over the next week or so.

BITCOIN: Alternative count…

for an invalidated Bullish count…

Recognizing that my previous count, bullish, has been recently invalidated…

Does not look to be an alternative bullish count right now, the correction is not finished and what I see fro the moment is a possible 3-3-5 FLAT Correction.

Hope I am wrong, but if not, 9400 USD should be the stronger support…


Disclaimer: This is just my personal point of view, please, do your own assessment and act consequently. Neither this post nor myself is responsible of any of your profit/losses obtained as a result of this information.


BITCOIN: Correcting but still upwards?

Quick update here…

It is clear that 13000 USD is a very strong resistance level. BITCOIN is now correcting after touching that value in the past few hours.

However, I am still confident of considering 14500 USD as a realistic target as planned 6 days ago in this post .

Also because I think this correction is forming the 4th wave of the Violet 5-waves count, so, still a 5th is missing.

This correction may “enrolled” further buyers who felt that they were late a few hours ago and I believe it should push again the price upwards…If so, a new Year’s High will come and the current resistance at 13000 USD will become our newer support.

The only thing I hope is that the new wave up will come mainly from “Fresh” FIAT and not mainly from the altcoins which are really being devastated by the Crypto King, including STEEM of course.

@toofasteddie


Disclaimer: This is just my personal point of view, please, do your own assessment and act consequently. Neither this post nor myself is responsible of any of your profit/losses obtained as a result of this information.

Crypto Contest July 10: Fantom

Fantom (Binance: FTMUSDT) has broken out of the triangle pattern in the four-hour chart.

(Chart courtesy of Tradingview.com (log scale))

Elliott Wave Analysis

In Elliott Wave terms, Fantom began a wave one advance on June 26. The red wave one (blue sub-waves i-ii-iii-iv-v) finished on July 3, and the red wave two (blue sub-waves a-b-c) correction ended on July 8. If this wave count is correct, Fantom should be heading next towards the July 3 peak in the red wave three.

(Chart courtesy of Tradingview.com (log scale))

Funnymentals

Fantom is the nervous system for smart cities. You can find the CEO presentation below.

(Sources: Fantom and YouTube)

How can I vote? Where is the contest?

You can vote by following this link.

? Daily Crypto News, July, 10th?

  • Bitcoin Price Eyes Move Above $13K as Dominance Rate Hits 2-Year High ;
  • IRS Allegedly Hopes to Make Tech Giants Release User Crypto Activity ;
  • Facebook to Senators: Libra Crypto Will Respect Consumer Privacy ;
  • Bitcoin’s Mining Difficulty Just Posted Its Biggest Increase Since 2018 ;
  • Facebook Has No Plans for Calibra or Cryptocurrency in India ;
  • ? Daily Crypto Calendar, July, 10th?
  • STEEM Trading Update

Welcome to the Daily Crypto News: A complete Press Review, Coin Calendar and Trading Analysis. Enjoy!

? Bitcoin Price Eyes Move Above $13K as Dominance Rate Hits 2-Year High

View

Bitcoin’s violation of recent bearish lower highs with a move above $12,061 has opened the doors for a retest of $13,880.


Prices reinforced the bull breakout with a successful defense of the former resistance-turned-support of $12,061 soon before press time.


Bitcoin’s dominance rate has spiked to 27-month highs, backing the uptrend in prices.


A high-volume UTC close below $12,000 would abort the bullish view.

? IRS Allegedly Hopes to Make Tech Giants Release User Crypto Activity

The United States’ Internal Revenue Service (IRS) is allegedly considering requiring tech giants to report on crypto activity by users, according to a presentation reportedly from an IRS presentation and provided by a Twitter user on July 9.


According to the documents shared, the IRS hopes to use Grand Jury subpoenas on firms such as Apple, Google and Microsoft to check taxpayers’ download history for crypto-related applications.


Known as Crypto Tax Girl, Laura Walter, certified public accountant and crypto tax specialist, tweeted the presentation, which was allegedly for agents in the IRS’s Criminal Investigation division.

? Facebook to Senators: Libra Crypto Will Respect Consumer Privacy

Facebook blockchain lead David Marcus told U.S. lawmakers that the social media giant plagued by privacy scandals won’t have access to personal financial information with its new cryptocurrency.


In a letter dated Monday to the Senate Banking Committee responding to pointed questions the lawmakers sent in May, Marcus took a diplomatic tone, acknowledging the panel’s concerns about data privacy and telling them:


“I want to give you my personal assurance that we are committed to taking the time to do this right.”


A similar letter was sent to the House Financial Services Committee, the Hill reported earlier Tuesday.

? Bitcoin’s Mining Difficulty Just Posted Its Biggest Increase Since 2018

Bitcoin mining difficulty – a measure of how hard it is to compete for mining rewards on the world’s first blockchain network – has posted its largest two-week increase in 12 months.


According to BTC.com data, mining difficulty reached 9.06 trillion (T) at block height 584,640 around 9:17 UTC on July 9, surpassing the previous record of 7.93 T by 14.23 percent. This was the strongest growth in any two-week period since August 2018 – a sign that competition among miners is not only intensifying but doing so at an accelerated rate.


The bitcoin network is designed to adjust its mining difficulty every 2,016 blocks (roughly 14 days) based on the participating mining power in each cycle, in order to ensure the block-producing time at the next period stays at about every 10 minutes.

? Facebook Has No Plans for Calibra or Cryptocurrency in India

Facebook Inc has no plans to offer its Calibra digital wallet services in its largest market, India, the social giant said, just as a top government official expressed skepticism about its newly-announced cryptocurrency Libra.

“There are no plans to offer Calibra in India,” a Facebook spokesman said in an email, effectively ruling out the rollout of its Libra cryptocurrency in the country. “As you may know, there are local restrictions within India that made a launch of Calibra not possible at this time.”

India’s central bank, the Reserve Bank of India, has banned banks from dealing in cryptocurrencies but informal networks abound. In an effort to curb them, the government is proposing a law with stringent penalties, including prison sentences of up to 10 years. Subhash Garg, the country’s economic affairs secretary, said in an interview to Bloomberg that India would not be comfortable with a private cryptocurrency.

image.png

? Daily Crypto Calendar, July, 10th?

The mainnet launch will be the kickoff for enterprises to provide their idle cloud resources in the Ankr application.

“In 104 hours $Waves blockchain is going to change forever! just 4 days. #dapps are coming home to #wavesplatform.”

Zcoin releases version 13.8.1.

“On July 10, PundiX and Binance will have a meetup in Medellin Colombia ”

“Interested in building on #EOSIO? Join us on July 10th from 8-10am (HKT) for a walkthrough of all you need to know about getting started.”

image.png

STEEM Trading Update by my friend @cryptopassion

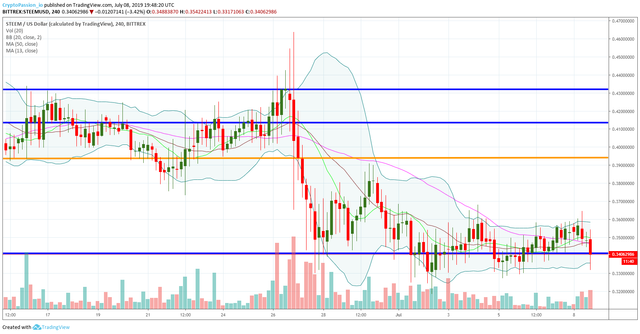
Here is the chart of yesterday :

STEEMUSD.jpg

Here is the current chart :

STEEMUSD.jpg

So most of the altcoins are still in depression mode and for sure it is also the case on the STEEM. Since yesterday, we are trying to break the support around 0.34$ but till now, we are lucky and that line is holding us. For how many times, I really don’t know but let’s at least enjoy that little positive news.

image.png

Last Updates

image.png

Play on a fair STEEM CryptoGaming website !

Join this new Free To Play on the STEEM Platform !

Litecoin Price Has Us Sitting With Anticipation

Anyone who follows Litecoin knows two things.  One of which is that the halving is happening in roughly 26 days.   At that point each mined block will be worth 12.5 coins rather than 25.

Second is the fact that litecoin had a nice bull run prior to BTC and much of that is assumed to come from the speculation of price running up into the halving.

Pausing to Pick up Steam or Already Passed the Peak?

There are a dozen ways to skin a cat as they say.  So when you look at the prior litecoin halving you will see stats that show a 400% percent run up into the halving, you will also see data that points out the top of that run was about 7 weeks prior to the actual event.

So the question is if history will repeat itself.  With the halving just under 4 weeks away and LTC topping out at 147 roughly 3 weeks ago the ingredients are there for a repeat of history.

We are not in a vacuum and apples aren’t oranges

The market now compared to 2015 (the last halving) is very different.  LTC wasn’t on exchanges like coin base and many others back then.   The market was very crypto fan centric then as opposed to having some average joe and institutional influence now.

I won’t dare use the term “this time it’s different” – famous last words of many.

However, I will recognize the different environment and act accordingly.

What is the chart saying?

In the end the price chart is old reliable for me.  It allows me to figure out probabilities and enter appropriate risk-reward scenarios.

Looking at the daily chart…

I see price consolidating after breaking down from the ascending channel formed in the 2 month bull run.

They keys is price tested and held that 108 area support after breaking the channel.  Looking at the daily chart the conclusion is a coin flip in my opinion.

Price could test 108 or even push lower considering it made a lower high after bouncing off support.  It could also push higher after digesting that large two month run in anticipation of the halving.

Either way, no clear edge in my opinion.  Advantage = neither direction.

However, let’s see what the weekly chart gives us, how does that price action look?

They weekly view makes me feel a bit bullish.  You can see after the run up price made an orderly pullback to that key 108 area and held it while letting the 10 period moving average catch up.

I really like that price is not extended on the weekly anymore relative to the 10 period as that average has acted as a good guide for when not to chase price and as possible entry point on a pullback in a bull run.

Basically as long at price is above 108 I’m long.  If we close below there then price seeing 100 would not be a surprise.

As for the upside, well that high at 147 would be the target if we see a run into the halving.

To trade or not to trade

From a pure risk-reward profile, if I were to add a new long here at 120 with anticipation of a run to the high then that would offer me a just over a 2 to 1 risk-reward on my money.

Not the greatest ratio but above my minimum threshold of 2 to 1 or better.

Either way we should get some kind of move soon as price has been consolidating a bit.

I’d of preferred to see price tick up over the last couple days with BTC pushing, but we don’t always get what we want.

I’m holding my long-term bag for now along with the handful of coins I added a few days back.

__________________________________________________________________________________________

If you are new to cryptocurrency and the blockchain download my free e-book:  Scaredycatguide to Knowing What the Heck Bitcoin Is

If you want to learn to read charts like ScaredyCatGuide feel free to check out my three part video series teaching support and resistance, u-tun patterns and time frame analysis, access is completely free!


Crypto Contest July 9: ZB

ZB (Bitfinex: ZBTUSD) has broken out of the triangle pattern in the four-hour chart.

(Chart courtesy of Tradingview.com (log scale))

Elliott Wave Analysis

In Elliott Wave terms, ZB began a wave one advance on June 4. The red wave one (blue sub-waves i-ii-iii-iv-v) finished on June 30, and the red wave two (blue sub-waves a-b-c) correction ended on July 2. If this wave count is correct, ZB should be heading next towards the June 30 peak in the red wave three.

(Chart courtesy of Tradingview.com (log scale))

Funnymentals

ZB.com provides trading service for blockchain asset such as Bitcoin, Ethereum and Litecoin to the customers around the world. FX Empire reviewed the platform last year.

(Sources: ZB and YouTube)

How can I vote? Where is the contest?

You can vote by following this link.

Tron in trouble. // Call the liquidators!

Image result for tron scam

Ill be honest, when i see TRX suffer, that puts a smile on my face. Im not one of those guys that loves all crypto or thinks that every project can succeed and that we should all hold hands.
I think thats a foolish thought thats shown to be wrong many times. Even now youre seeing it with Steem slipping towards no.100 in MC.

Why should i hold this token instead of that other one?

Its a simple question that clearly shows that holding hands aint possible. You can collab between chains, but those alliances are short lived and on wobbly legs.
Its a doggy dog world and when i see and overvalued, overhyped token suffer, im happy, what can i say.

Anyways….

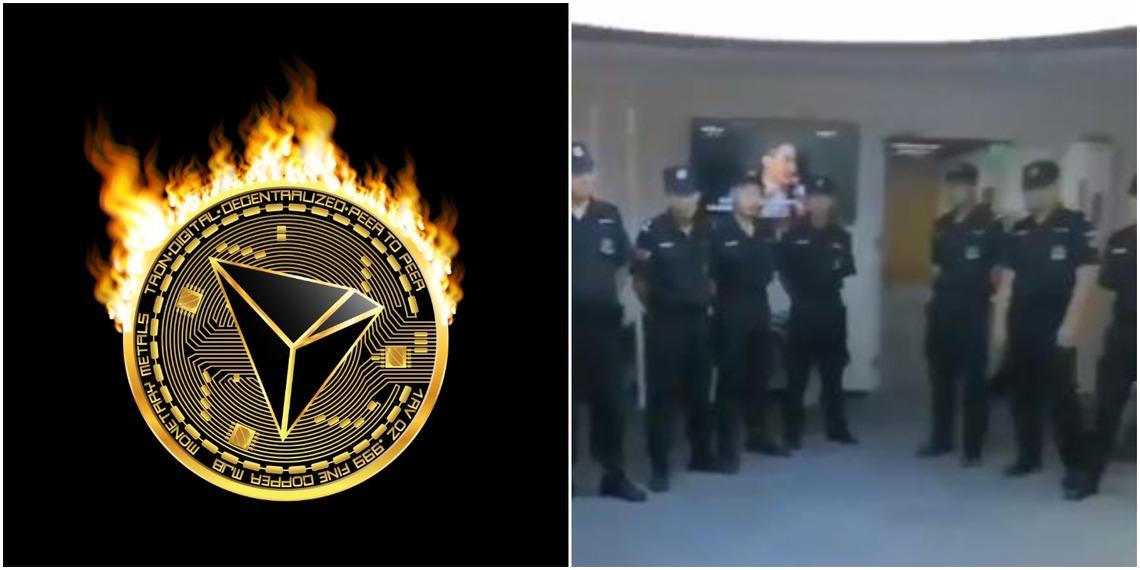
So what happened the other day is that some disgruntled protesters showed up at the offices of a partner of the Tron Foundation mad, yelling that Tron is a scam.
Apparently some group defrauded some folks using Tron name and the video of the protest went online where it appears the offices were raided by police.

Now, that probably isnt true, it just seems that they have been watching the protest. Take a look for yourself.

It seems that this wasnt really anything of note that will bring the behemoth built on cheap hype down. I wanted to share this because its just fun for me seeing Tron in trouble. When Steemit inc layed off folks, that was probably the trigger for Steem to drop out of the top100 tokens.
Dan Larimer gloated, EOS cockroaches crawled out to gloat, crypto influencers that tried and failed on Steemit hit Steem when it was down….

So what do i say when Justin has to do damage control and his shitty antics arent fooling anyone??

Image result for can i have some more

You know what is UP when the Market is Down? $TWTR

The ole MO strikes again with the Twitter bird. The market gets smoked, and $TWTR rips higher. You can’t make it up folks, it happens regularly.

I have been long $TWTR a while since last earnings and still sitting green. It looks like I am going to have to be in it this earnings as well and looking for a run up. $TWTR is a no brainer IMO and I have been saying this from the early 20s and been on the platform 9 years. I am looking for this to make a VERY BULLISH move here.

Buy $TWTR.

BITCOIN: iHS triggered?

Just a couple of days ago I was writing a post about an interesting pattern in formation. It was an Inverted Head and Shoulder pattern and I told it has the potential to allow a continuation trend upwards with a target of 14500 USD.

The following was the pattern I was talking about:

And what we can see right now is that after breaking the neckline at 11760 USD the volume is increasing consistently:


Those two higher bars at the volume of the 4 Hour chart may indicate an acceleration of the price action and so it is what is exactly occurring. A good example of one of the most succeed patterns in TA, in this case it is acting as a continuation pattern on a Bullish Scenario.

The target of this pattern points right now towards a new High of the year around 14500 USD, will see how close BITCOIN will be from that level in some hours from now.

As usual, pay attention to the chart and anticipate the move in order to get the most from it.

@toofasteddie

Disclaimer: This is just my personal point of view, please, do your own assessment and act consequently. Neither this post nor myself is responsible of any of your profit/losses obtained as a result of this information.