In Elliott Wave terms, Metahash began a wave one advance on July 17. The red wave one (blue sub-waves i-ii-iii-iv-v) finished on July 21, and the red wave two (blue sub-waves a-b-c) correction ended on August 4. If this wave count is correct, Metahash should be heading next towards the July 21 peak in the red wave three.
MetaHash is a next-generation network based on the Blockchain 4.0 technology for sharing digital assets and a platform for creating and managing decentralized apps and services in real-time. You can watch their latest presentation below.
Bitcoin (BTC) has risen back above $11,000 after regaining ground lost on July 8 and July 22, when the world’s largest cryptocurrency by total value suffered bearish breakdowns that sent its price below $10,000.
At 15:00 UTC on August 4, bitcoin rose above $11,000 for the first time in 21-days.
BTC’s price stalled and then was retested along the $10,600 area on Aug. 4, proceeded by a breakout above $11,000, 10 hours after its most recent sell-off. BTC was last seen changing hands at $11,227 after a strong hourly candle broke above $11,050.
Following a recent hard fork of Bitcoin SV (BSV), the network saw a three-chain split after a massive 210 megabytes (MB) block was mined.
As reported by BitMEX Research on Aug. 3, Bitcoin SV nodes divided into three groups on Saturday, making the network to split into three separate chains. According to the report, 65% of nodes were located on the current tip, while 17% were stuck on the 210 MB block and 19% had not even upgraded and were on the old pre-hard fork chain.
According to data from Coin Dance, the 210 MB block was mined on Aug. 3 by CoinGeek miner and involved 808,633 transactions.
Bitcoin SV, a hard fork of Bitcoin Cash (BCH), which is in turn a fork of the major cryptocurrency Bitcoin (BTC), successfully ran its own scheduled hard fork on July 24 as part of plans to increase its block size from the previously set limit of 128 MB up to 2 gigabytes.
The total computing power now dedicated to securing the bitcoin blockchain has set yet another record.
According to data from mining services operator BTC.com, the average bitcoin mining hash rate over the last two weeks has reached 71.43 quintillion hashes per second (EH/s), up from 64.49EH/s on July 23. The threshold was breached as bitcoin adjusted its mining difficulty at block height 586,672 on Monday 2:52 UTC – that is a 6.94EH/s, or 10.78 percent jump since mid July.
Bitcoin mining difficulty is a measure of how hard it is to compete for mining rewards on bitcoin. Just how difficult the bitcoin software makes it to generate new blocks adjusts every 2,016 blocks – approximately every 14 days – to ensure the block production time remains about 10 minutes at the next cycle.
Max Keiser, a former Wall Street trader and host of the RT program Keiser Report, said that he believes Bitcoin (BTC) will break $15,000 this week.
In tweet published Aug. 3, Keiser said that he is “sensing #Bitcoin will cross $15,000 this week.” He further stated that confidence in central governments, central banks and centralized fiat money are at the lowest level they have been in decades. He noted:
“I’m confident. So I just burned another $10,000 in $USD shitcoin. Correlation does not equal causation, but whenever I burn a few thousand $USD, BTC price goes up significantly.”
One of the murkier corners of the cryptocurrency market is becoming even less transparent.
Tether, the controversial token that serves as a conduit for trading coins on many of the world’s largest crypto exchanges, is becoming the means for conducting transactions on a spate of new blockchains, the distributed digital ledgers that underpin the digital assets.
The migration from the dominant Bitcoin and Ethereum platforms risks making it more difficult for investors to track transactions, going against one of the key tenets championed by crypto advocates since the advent of the self-styled alternatives to money a decade ago.
“At the start of every month, we will be taking snapshop of all EthereumX token holders with more than 300,000 ETX tokens.”
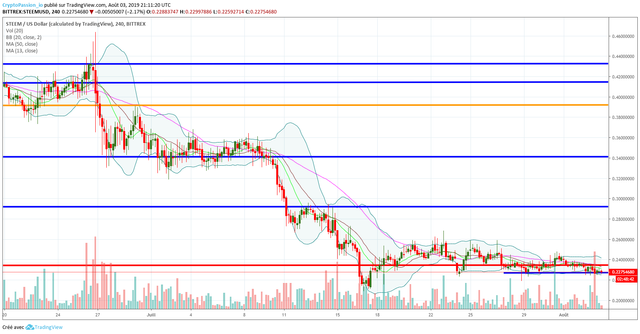
STEEM Trading Update by my friend @cryptopassion
Here is the chart of yersterday :
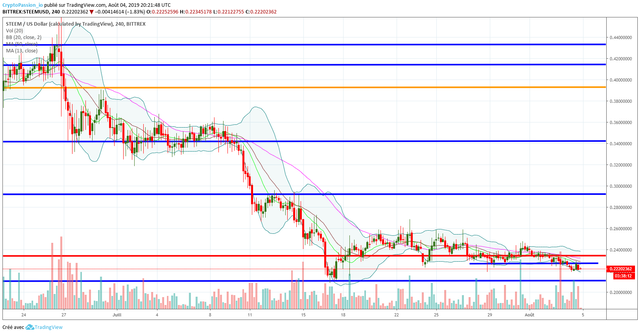
Here is the current chart :
So yeah my friends, except if we have a sudden big up in the coming hours, the support line at 0.24 and the little support just under in blue can be considered as broken. We should now go in the direction of the support line at 0.21$ which is a major support line which hold us since december 2018. If we break that support… I really don’t know where we will stop… 0.15$, 0.1$, 0.05$, 0.01$? what would be the minimum for you ? Let’s share your opinion.
Bitcoin has had a slow and rather quiet move higher over the past few days. That is until today where volume has picked up in the past few hours and price pushed more than 600 points.
11,600 has been a pivot point before
Looking at the chart you can see price has come up to this level in the 11,600 area. With price now getting a but extended from the 10 day moving average and volume being somewhat low for this move on a whole it would not be a surprise if the up move died in this area.
However, if that were to happen then some sideways to slightly lower consolidation would be bullish.
To be honest as long as it maintained above 10,800 while the moving average caught up I’d be happy with the price action.
Safe havens currencies retain or increase in value during risk off environments, meaning when economic turbulence is upon us. Three major safe haven currencies are the U.S. dollar, the Japanese Yen and the Swiss Franc. In the past several months we have witnessed a divergence in the equity markets. While all major equity markets around the world are doing down, the US market is the only one holding on for dear life. So in a risk off environment commodity type currencies decline in price as a result.
On July 1st I when short two different Japanese forex pairs.
Monthly Chart (Curve Time Frame) – monthly supply is at 0.05600 and monthly demand is at 0.04600.
Daily Chart (Entry Time Frame) – the chart suggests to short price at the daily supply at 78.000.
NOW – this trade is still in play at this time.
Both trade set-ups were a Reward to Risk of 5:1. So although I was stopped out on the USD/JPY, if the CAD/JPY ends up hitting my target, my account will go up 4%.
The game of trading is a probability game, which you most trades have less than a .500 batting avg (win/loss ratio). However, as long as your avg win is greater than your avg loss, your equity curve should be positive. Let me illustrate, if my avg. win is 3X my avg. loss, all I need is a minimum win % of 25% to be profitable. And if your avg. win was 20X your avg loss, you only have to be right 5% of the time. This is why I stopped sweating my losses years ago because my losses lead to my wins. Until next time.