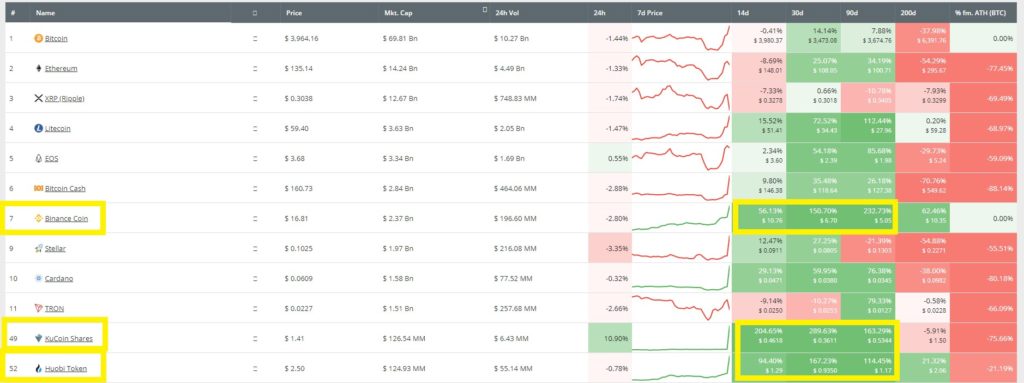
The theme that binds these three coins beyond being exchanges is the recent issuing of exchange offerings. These Initial Exchange Offerings (IEOs) function very like an Initial Coin Offering (ICO) and have generated a lot of enthusiasm for the exchanges hosting them. Critically, IEOs offer a use case for the
The main event for the New Zealand Dollar this week is the Reserve Bank of New Zealand (RBNZ) interest rate decision tomorrow. Many analysts expect the RBNZ to leave rates unchanged at 1.75% tomorrow.
The New Zealand Dollar, like the Aussie is highly sensitive to developments in China. U.S.-China trade talks are scheduled to start up again this Thursday. Any positive news will be bullish for the New Zealand dollar, but bearish if the talks stall again with no clear path forward.
Ahead of these two events, I put on a position trade this morning.
Monthly Chart (Curve Timeframe) – monthly supply is
Following the last movements of BITCOIN on which we are
currently experimenting a drop on the price, we can see some signs of
“exhaustion” in the rise of some of the major altcoins that have led the
rise lately.
This is the case of LITECOIN and BINANCE Coin.
On LITECOIN:
we can be very satisfied of its performance, it has completed 5 waves, forming a promising 1st one in black. The price has grown constantly from 24 to 64 USD in the last 3 months but, unfortunately, the RSI seems to indicate a clear DIVERGENCE on the rise of the last three Highs…
Looking at the weekly chart, we can see 3 major areas of resistance price is currently hitting. The first is a major descending resistance line that’s been in place since April of 2018. The second is the top of the wedge (possible bear flag) price is consolidating within now. The third and last is the area of resistance between $4,000 and $4,120 I’ve been discussing over the past couple months.
Zooming in on the weekly chart reveals last weeks candle closed as a doji. This is a neutral candle and suggests an epic battle between bulls and bears to either break
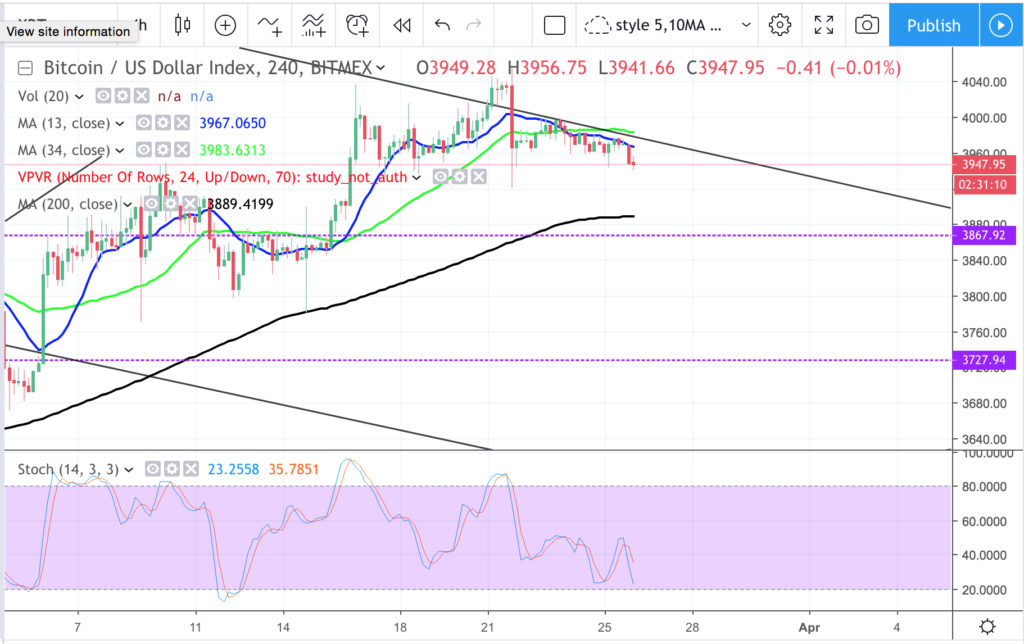
On 4hr chart, made lower lows, stoch oscillating for more room downside. Likely to break 3900. Possible mini IHS with 3950 neckline, downside tgt to test 3870 support zone.
News: (Current) | (Upcoming)
Short term moving average (day candle) :
RSI :
Network Value to Transactions Ratio :117
Total marketcap :139
Dominance :50.8
Bitfinex Margin Long/Short Volume Ratio :
Depth Chart : (S) | (R)
Weekly Timeframe :
The ASX (Australian Stock Exchange Limited) was formed in 1987, is the largest exchange in Australia and is one of the top exchanges in the world with a market capitalization of about 1.2 trillion US dollars. Some of the companies traded on the ASX include, Qantas Airways, Rio Tinto and the Westfield Corporation.
The S&P/ASX 200 is an index that benchmark’s the ASX. It is based on the 200 largest ASX listed stocks, but Standard and Poors usually balance the index every quarter
The big four banks, the major miners and the energy sector have all dragged Australian shares lower,
Bitshares has been up as much as 30+% today on some MASSIVE Volume. I have been a big proponent of graphene based blockchains because the ability to scale and how quickly they can move transactions and confirmations. Currently bitsahres is trading over $0.063 and one of the biggest movers on coinmarketcap.
Does anyone know the reason for this spike? Was their news…or are people just getting smarter?
Granted the level is 20% from where it was a few hours ago, you now have a MASSIVE level to hold long against.
As someone that used to follow the gaming scene i found the news on Google entering the “gaming platform” industry very interesting. When i say its entering the gaming console industry i dont mean that they are creating their own console, but rather disrupting the current state of things.
So what is Google Stadia?
Google Stadia is a cloud based gaming platform that eliminates the need for expensive hardware and will allow anyone to play any game in 4k, at 60 FPS.
Simply put, all you will need to have to play any game of your choice is a controller or a mouse and a screen.
The way it works is through the power of the internet and Google unlimited resources. The games arent played locally but are rather streamed to your screen of choice. The only thing you need is a strong internet connection which could be a problem for some. There is no pricing set at this time but i could see GOOGLE Stadia turning into a NETFLIX of games.
Sure, Google Stadia does sound corporate but the value it would bring to the consumer is immense. I have no doubt that Google can pull this off, the only question that remains is how they will do things from the profit sharing side. There is a difference between movies and games in how they are consumed by end users. There is also a price difference, that is a significant one, between a movie ticket and a AAA game.
I dont know what will happen in the future, but if Google Stadia manages to get enough games on their platform and they manage to work out the profit distribution, we might be seeing Playstation, Xbox, High end gaming PCs going the way of the Dodo.
You dont need a 1000 USD graphics card when you can play AAA games on your microwave.
The Dow Jones Industrial Average DJIA rose 181 points on Friday, making it the ninth straight weekly gain for the Dow and the first time since 1964 that the DOW rose in the first 8 weeks of a calendar year.
This recovery since the Christmas lows is primarily due to Fed Powell succumbing to the Markets demands and putting its interest-rate policy on hold.
Two weeks ago I posted,
Party Like It’s 1964 – Part 2
Now price find itself right above the 200 simple moving average. In addition, the 50 simple moving average is starting to
SpaceChain (Bittrex: SPCBTC) has broken out of the triangle pattern in the daily chart.
(Chart courtesy of Tradingview.com (log scale))
Elliott Wave Analysis
In Elliott Wave terms, SpaceChain began a wave one advance on January 14. The red wave one finished on January 30, and the red wave two correction ended on February 13. The red wave three advance finished on February 26, and the red wave four correction ended on March 22. If this wave count is correct, SpaceChain should be heading next towards the February 26 peak in the red wave five.