BAT seen from the temporality of 4H we can see how the previous candle has closed below the key support located at 0.00002387, the price has tried to make a pullback recovery, however, has not managed to test the zone correctly to confirm it as support, now the price could go in search of the demand zone at 4H located at 0.00002254, if you do not find enough strength to push up, increase the odds of a reversal into the next zone of demand located within the price range of 0.00002107 – 0.00002149 indicated in the chart above by a blue rectangle, in that zone of demand the price would be throwback us corresponding to the break of the major figure in 1D.
BAT seen from the temporality of 1D we can observe from a broader perspective the current movement of candles, we see how the price during its bearish movement was put into a parallel channel that was finally broken up during the closing of the weekly candle, the price after having found support at 0.00001614 achieved the necessary momentum to make the bullish movement that has achieved the recovery of the low range of the major figure located at 0.00002349, as I mentioned before, the price should make the reversal that tests the diagonal support of the parallel channel indicated in the chart by the dark blue diagonals, once the test is done correctly, we should have an upward impulse towards our first gain target located at 0.00002860 indicated in the chart by the black horizontal, our second target is located at 0.00003138, also indicated in the chart by a black horizontal.
In conclusion, the price action currently indicates a retracement, the first zone where it should find demand to follow its bullish movement is located within the price range of 0.00002107 – 0.00002149, if the price does not hold the support and confirms a much retracement May, then the price could fall to 0.00001800, even find strength in the previous support located at 0.00001614, it is still too early to determine with greater certainty the next short term move for BAT, an ABC pattern has been formed, we should have a similar retracement pattern or one of 5 waves, so I recommend to be very attentive to the action of the price in 1D, always use stop loss in your trades to avoid invalidations during the move.
As I always say, you have to be aware of the movement, invalidations can occur, there is no 100% reliable analysis, take your own precautions when trading.
Intermarket analysis is a powerful tool that gives traders/investors a macro predictive direction of stocks, bonds, commodities and currencies. Intermarket analysis states that all asset classes are interrelated and that you can’t definitively determine the direction of one asset class without examining the other asset classes.
There are several key relationships that bind these four markets together. These relationships include:
The INVERSE relationship between commodities and bonds.
The INVERSE relationship between bonds and stocks.
The POSITIVE relationship between stocks and commodities.
The INVERSE relationship between the US Dollar and commodities.
NOTE:
A rising Dollar puts downward pressure on commodity prices because many commodities are priced in Dollars, such as oil. Bonds benefit from a decline in commodity prices because this reduces inflationary pressures. Stocks can also benefit from a decline in commodity prices because this reduces the costs for raw materials.
Gold is sort of a commodity. It’s a hard asset and mined like any other metal. However, it behaves more like a monetary asset, especially against the US dollar. As a rule, when the price of the US dollar goes up, the price of gold goes down and vice versa. However, while gold typically has an inverse relationship to the dollar, it’s not always the case.
The past year has been somewhat surreal in the gold market, as we have the rare occurrence of the dollar rising in somewhat slow fashion while gold bullion has appreciated about $300 per ounce to trade near $1,500. Historically, a rising dollar and rising gold bullion haven’t gone together, but the distortions that have come with global quantitative easing policies are to blame for the breakdown in this inverse relationship.
Moreover, if the Fed is cutting the fed funds rate and the European Central Bank is accelerating QE due to the bad economic numbers from the Old Continent, the dollar will not decline, as the interest-rate differentials are still in favor of the greenback.
Still, the excess reserves in the global financial system, which are a function of QE policies by the ECB, Bank of Japan, Bank of England and the Fed, are what has given gold enthusiasts the hope that we will make fresh all-time highs in gold bullion
So this US Dollar and Gold correlation may last a bit longer as both have more room to the upside before hitting monthly supply zones, which means they could fall together as well once they both reach the monthly supply zones.
US Dollar
Gold
This post is my personal opinion. I’m not a financial advisor, this isn’t financial advise. Do your own research before making investment decisions.
Do you know that Liberland has first humanitarian organisation? It has already helped in Somaliland and Serbia! For more information https://www.liberlandfoundation.org/
Long time since I posted my last post about BITCOIN , I think last time was on August 24th and I talked about the evolution of a complex WXY Double Combo correction.
Answering to a request of @beiker, I am going to show you what I think can be the possible scenario currently on-going.
The Y leg was in doubt that time, we were either thinking a possible triangular shape or a Flat configuration in order to end the wave II of BITCOIN.
However, it seems that the most likely, in my opinion, is a finalization of the correction by a FLAT configuration for the “Y” leg:
In my opinion, currently we have 2 possible termination areas probabilistically speaking:
The area around the 100% of the FIBO length of the wave “W”, corresponding to 7400 USD
The area around 5500 USD which is around the 127% of the FIBO length of wave W
Of course, the volume is so small that I would no enter in any LONG position till a clear increase of this variable will become a fact.
@toofasteddie
Disclaimer: This is just my personal point of view, please, do your own assessment and act consequently. Neither this post nor myself is responsible of any of your profit/losses obtained as a result of this information.
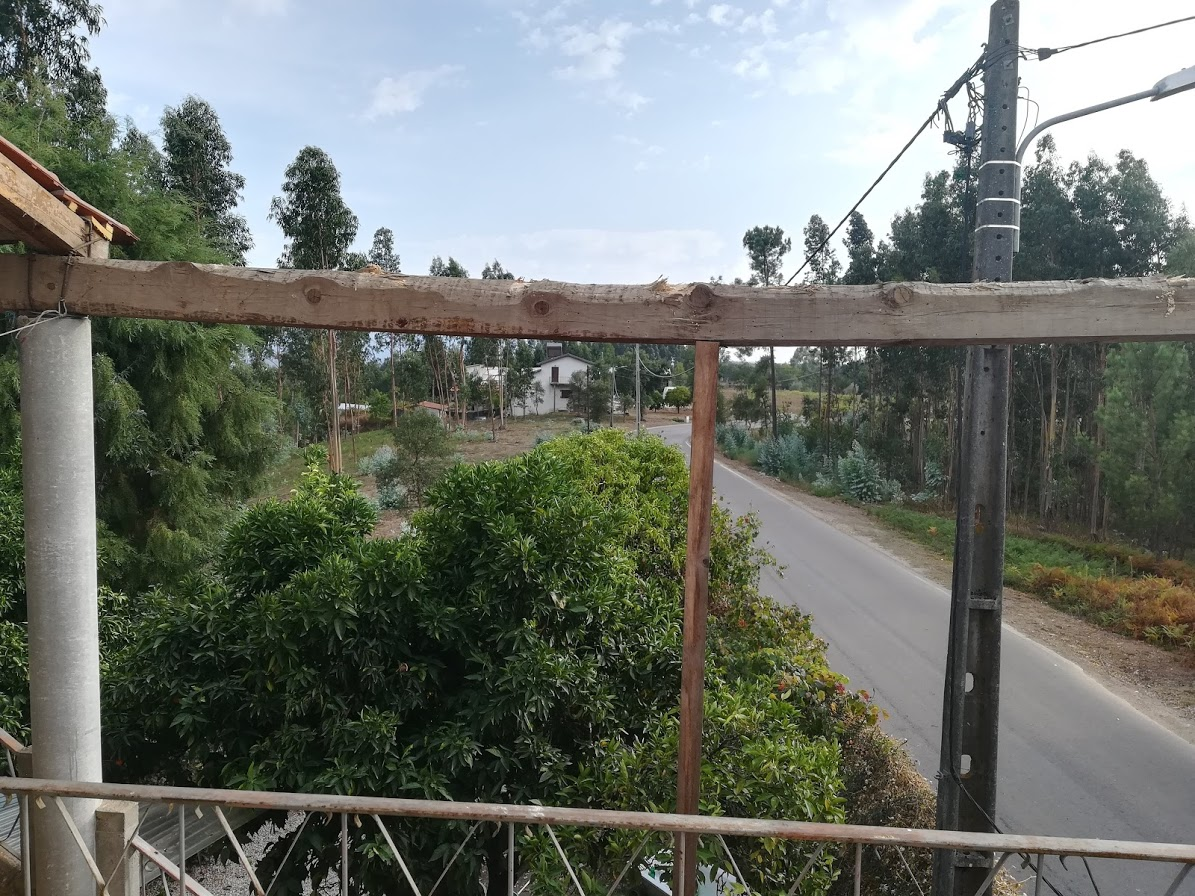
I had been hatching a plan for a number of days, weeks maybe, for how to get this last piece of the puzzle, this really long beam, down.
Its complicated by the fact that it hangs out so far away from the terrace on two stilts. I do not have scaffolding and research showed me it was incredibly expensive if I wanted to buy.
Where I was…
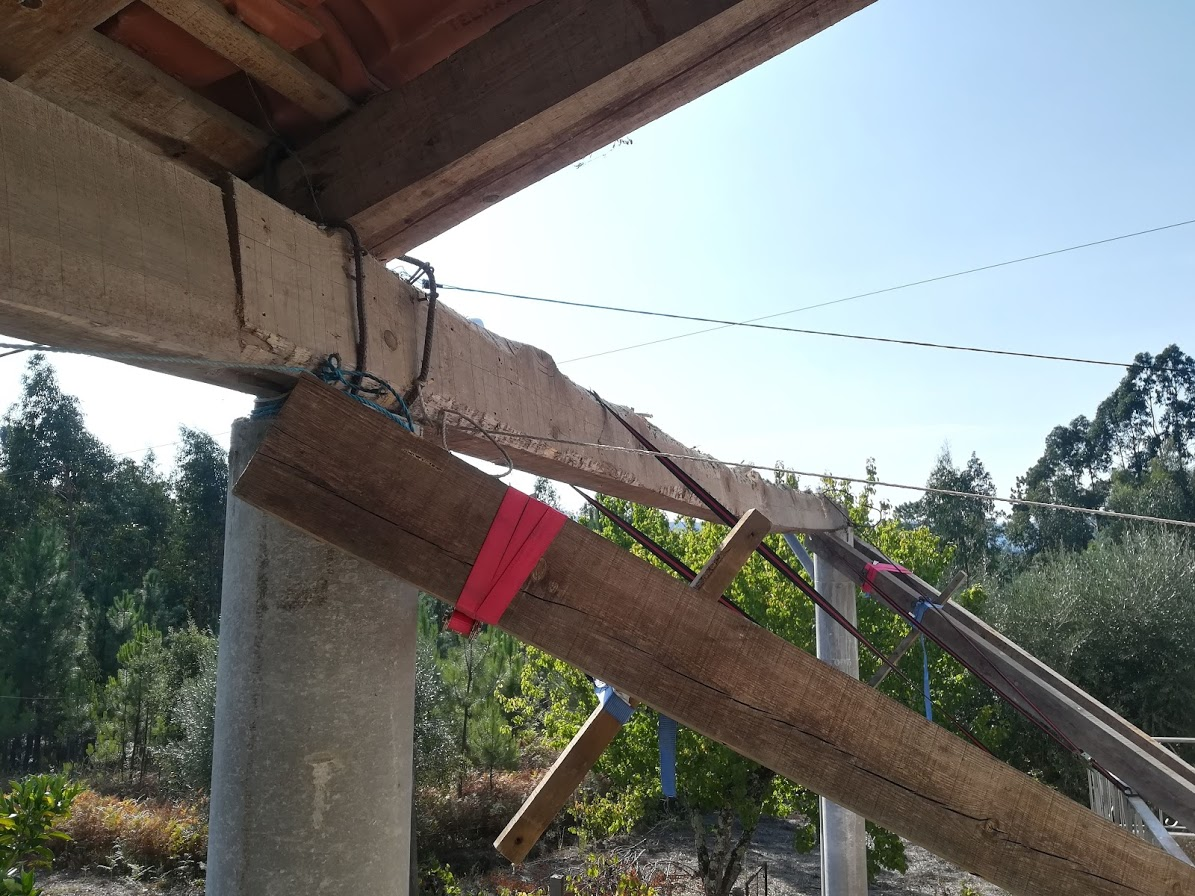
At the end of the day, after having cut all the other beams, I started testing out a theory. Even though the beams have been infested by pests, they still seemed sturdy enough to carry the weight of the beam I had to take down. Here you can see how it hung out off the edge of the terrace.
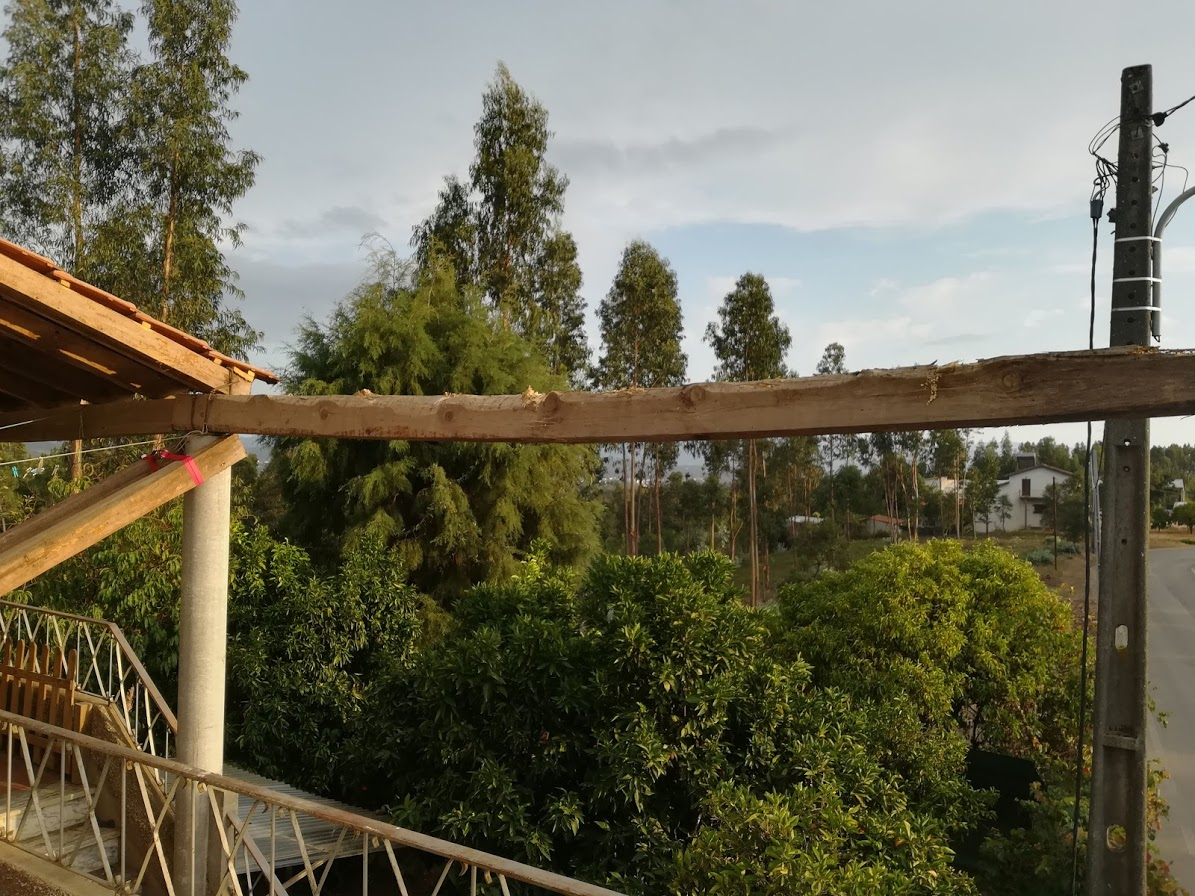
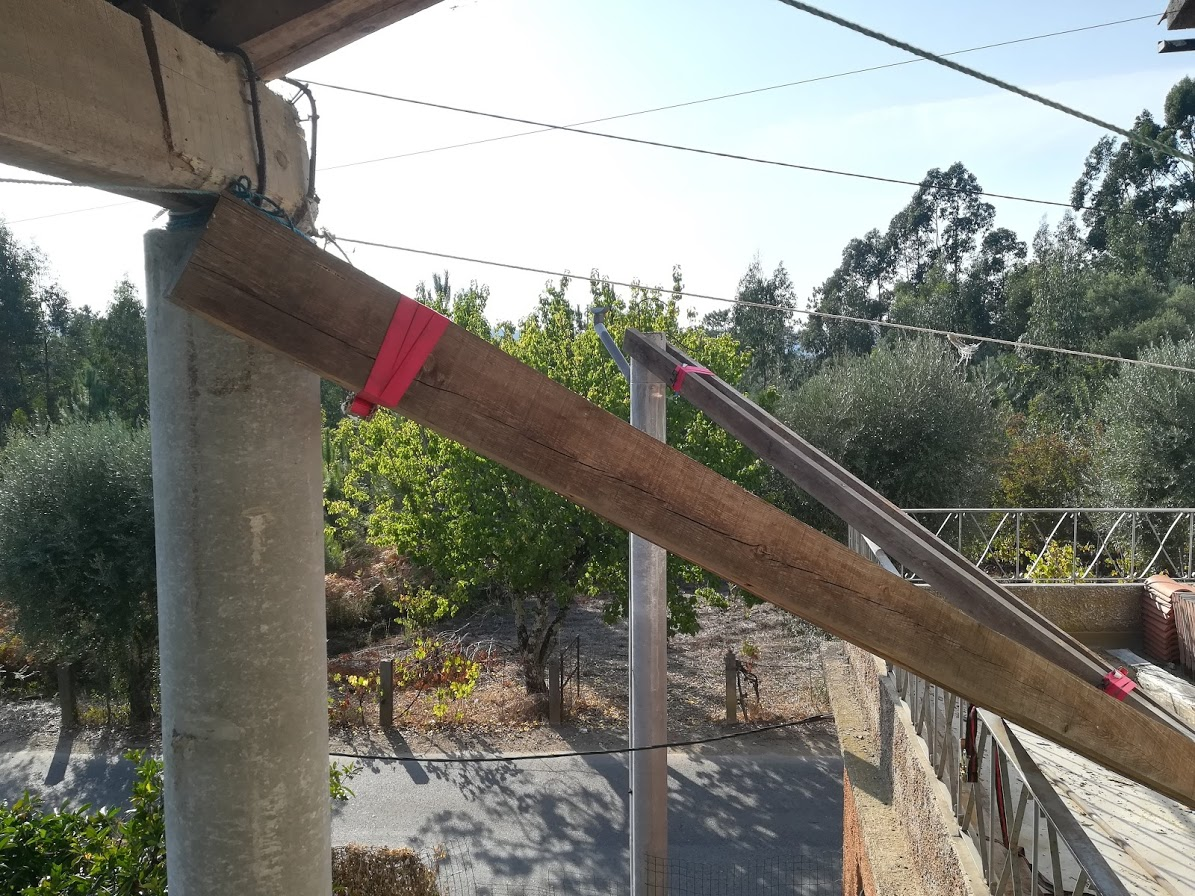
A shot from the side does not do much to highlight just how far that feels when you are trying to move something as long and heavy as that wooden beam!
If you look closely at the wood resting on the concrete stilt, you will see it has started collapsing. The wood at that point had been eaten away so much that it was sagging around the concrete stilt.
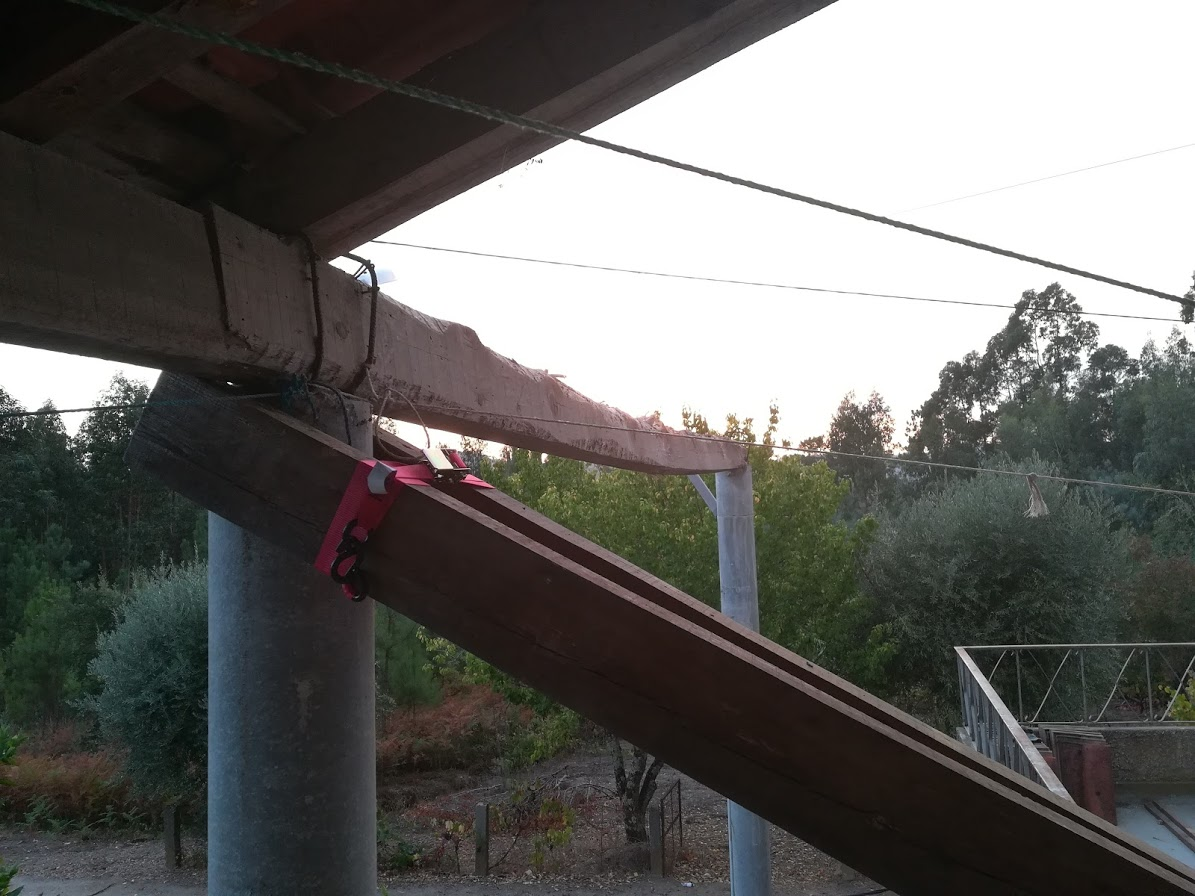
Tie me down
I had an idea that if I took two lengths of wood, one either side of the concrete support, then used a tie down to pull them together, then the friction would keep them up there, maybe even be strong enough to carry the weight of the wooden beam.
I tried it on one side that evening. It seemed to work well enough to carry my weight!
Motivated by this success I packed it up for the night, eager to get this perceived danger down and out of the way.
A nerve racking finish
I had planned this out and worked through as many scenarios I could think of, where things could go wrong, so felt prepared, however when it comes do doing sometimes you cannot escape anxiety.
I did the same with wooden beams on the other support, then tied their ends together too, that way they both supported one another and were less likely to start slipping down.
Fortunately because of the way I arranged it, and time it slipped down it would try and spread the wood further apart. I added short lengths of wood on each side. The idea was to cut the long wooden beam on on side, then let it rest on the supports I had added. If it did start to slide, then it would be caught by these short lengths. They ended up not being needed but I was glad they were there.
After much sawing, whilst leaning out over the stairs, I had cat the beam loose. I did not stop to take photos as I wanted it down ASAP. I had to use a length of steel pipe to lever the far side over the rebar that had been wrapped around it. Then bit by bit lift and move an end close to me, the move to the other side and repeat.
Because the gap between my supports narrowed the close they were to the terrace it got easier and easier to move the beam.
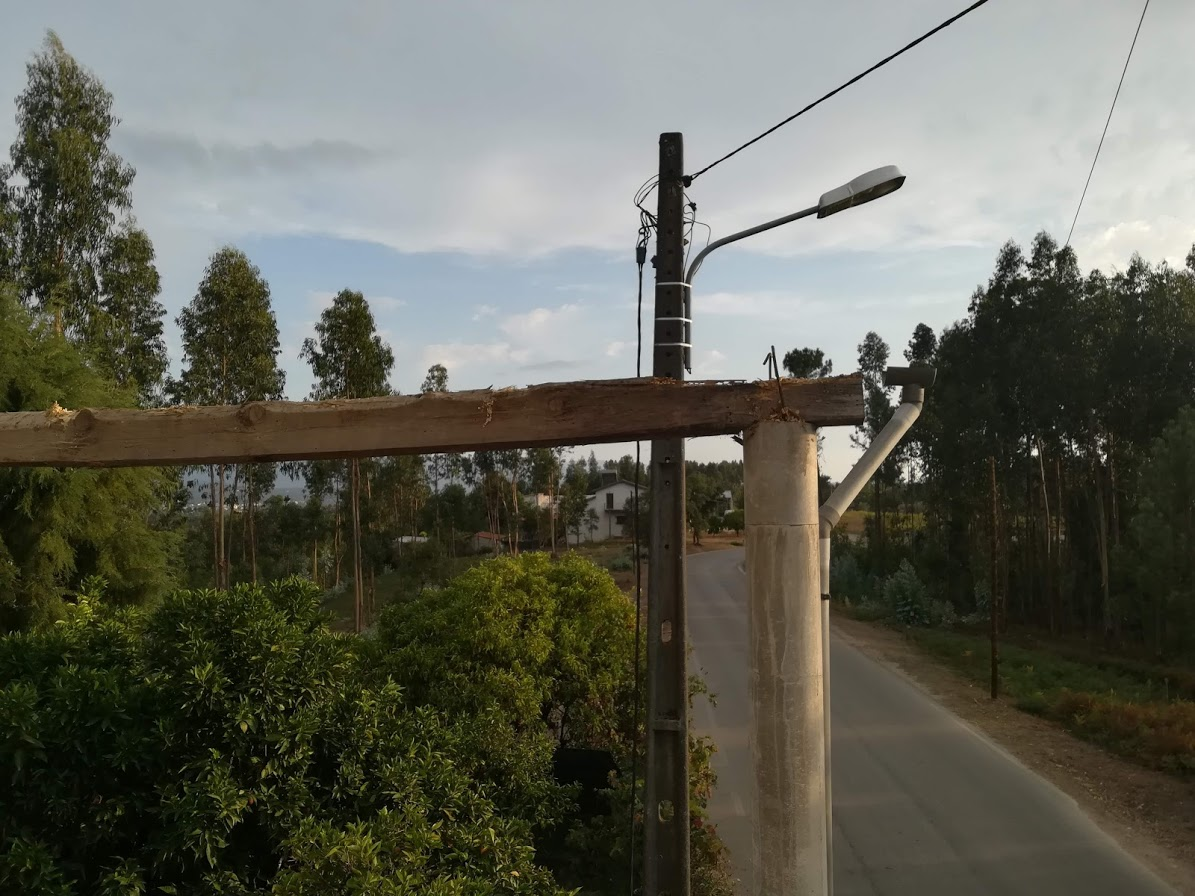
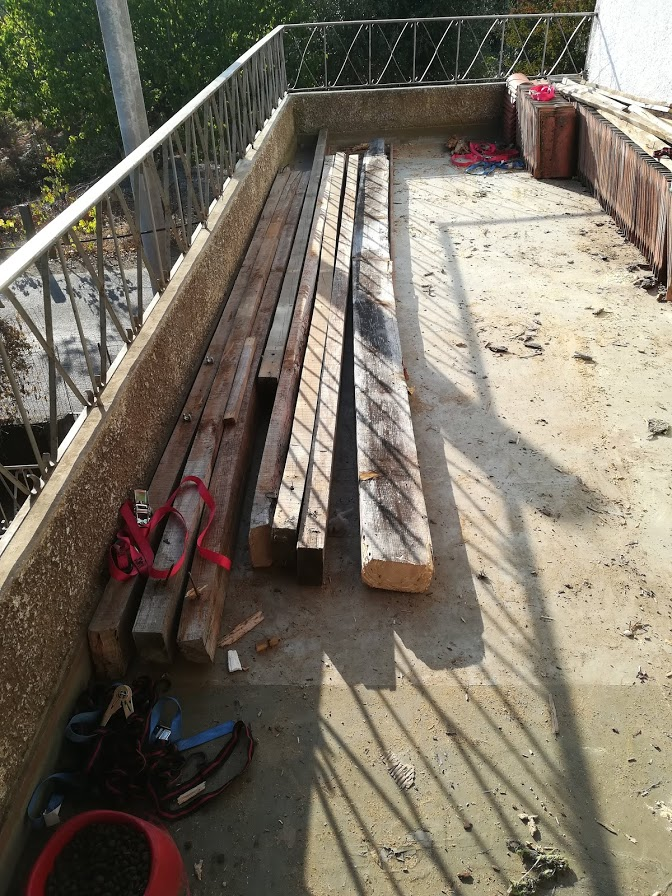
Job done, now to clean up
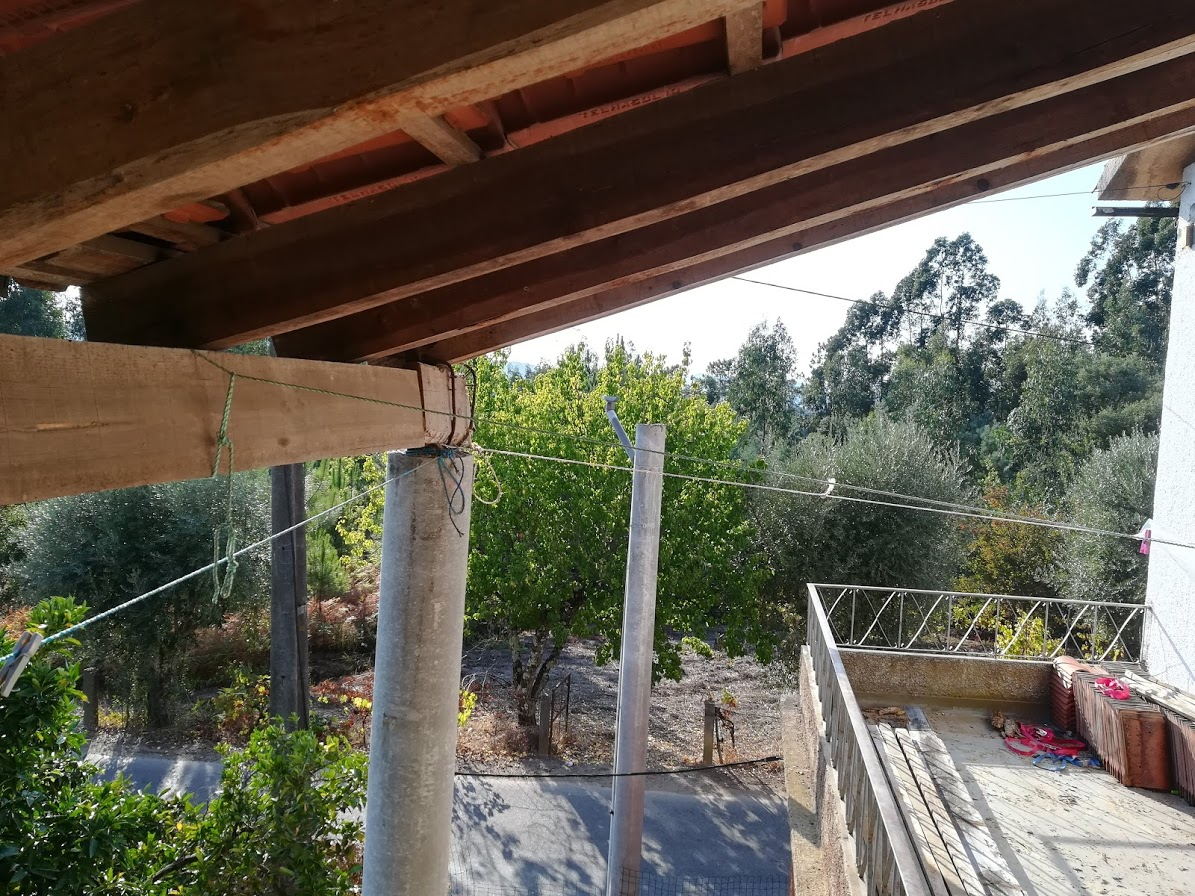
I took a few shots once the supports were taken down, I was just so relieved it went as smooth as it did.
If you take a look at the beam you will notice how much it had actually sagged, I still think it was close to breaking with the weight of the tiles and wood resting on it.
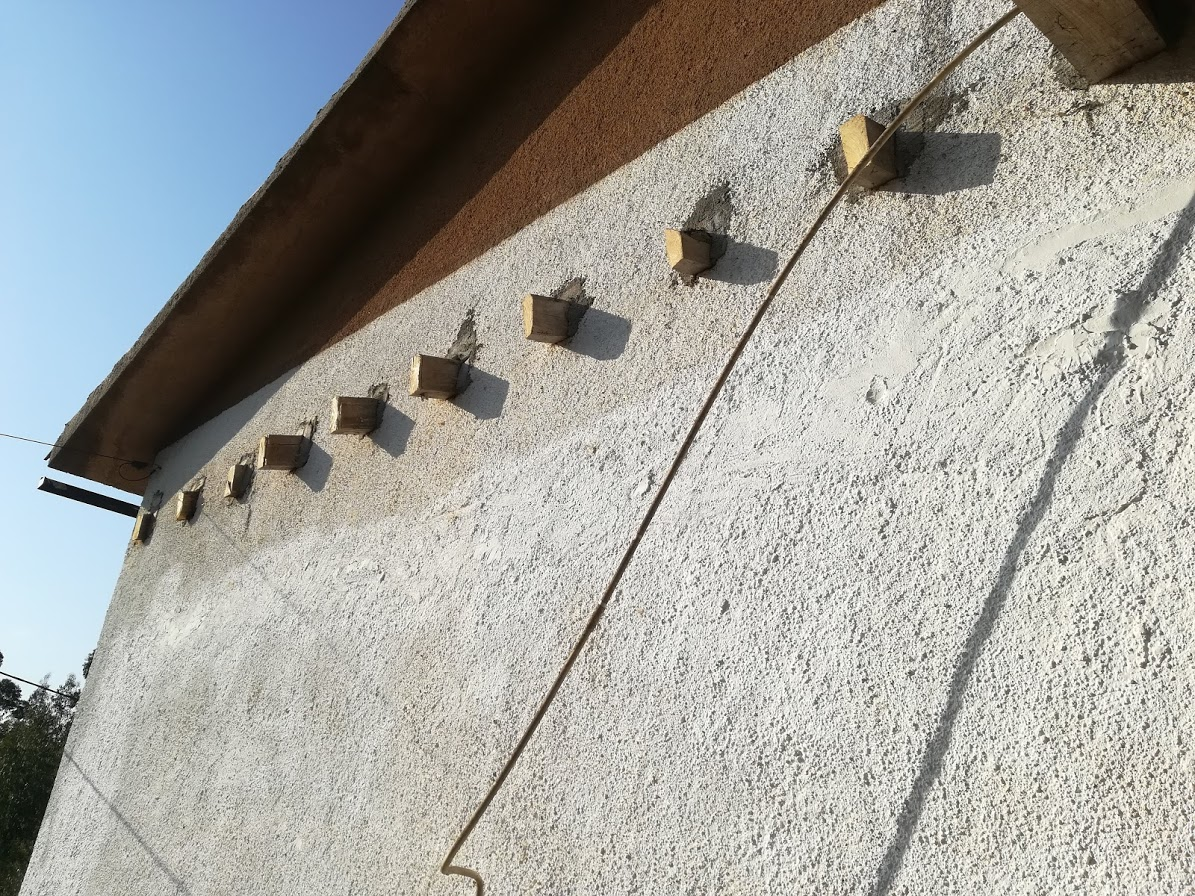
I have these bits of wood sticking out of my wall now, not sure how to handle them…
The terrace feels so much more open just with that beam missing. The downside is that we get beaten by the sun in the afternoon now, it makes it a bit uncomfortable to spend time on the terrace late afternoon.
I tried to capture just how tall this is, I don’t think it comes through in the photo though. It’s amazing how strong concrete can be though!
I am finally done with this, so many other projects around the house though, I cannot wait to get started on them!
Note: This post is written as an entry into the CryptoMood Content Competition hosted on Trybe. Why don’t you make a note to enter it yourself? Prizes are pretty decent and you have until the end of October to check CryptoMood out and to write your own review.
Let’s begin
The competition rules state that this post/review “should be written as an answer to the question “What would you have done if you had access to CryptoMood 3-5 years ago?” “
I’m going to make things really simple by answering that question immediately. My answer is this:
“I would use it the same way as I do now.”
This post tells you how I use it
I’ve been trialling CryptoMood for well over a month now, and I can happily report that it has passed the Brain Test.
What’s the Brain Test?
Like most ancient people (I’m in my 40’s), I’m stubbornly set in my ways: I like what I like and I don’t want to move outside of my comfort zone. I stick with what works for me.
But: I’m also well aware that technology moves ahead at a rapid pace, and that you neglect it at your own peril. I look in dismay at Octogenarians in my own family at the moment: at risk of being cut off from the world because they can’t send a simple e-mail message or operate a touch screen phone.
True story: A year or two back, I setup a laptop for a certain old lady. ALL she had to do was turn it on – one button. I configured it to boot up, connect to the internet through her cellular dongle and open her e-mail program for her, all without displaying any pop-ups or screens where she had to click “Okay” or “Yes” or anything like that. It was still too confusing for her, she still managed to get it wrong.
Trying not to end up like the poor little old lady I just spoke of, I make a habit of continually trialling new things. I keeps me abreast of the latest developments and teaches me how to use them. It also gives me a good idea of what is unique in the market, what works (or doesn’t work), and most importantly: what I should continue to use (and what I should just ignore).
This last part is the Brain Test. To have ‘passed the Brain Test’, means that something has been used by Bit Brain throughout the trial period, and now continues to be used by him.CryptoMood has passed the Brain Test.
Look, I’m not here to shill products, you know me better than that. I’m not saying that you must use CryptoMood. I’m not saying that it is my number 1 crypto tool or even that I use it daily. My primary crypto TA tools remain the raw charts. For monitoring the prices of coins, I still use CoinGecko. My primary FA tool remains the many crypto news sources which I check continuously.
What I’m saying is that CryptoMood does have value to me. Like most tools, there is more than one way to use it, it certainly offers more than just one function.
Personally, I use it mainly in two ways:
Crypto Market Sentiment Analysis
Missed News
Crypto Market Sentiment Analysis
CryptoMood does this very well, in fact, it’s designed around it. The app correlates news stories about different cryptocurrencies and then obviously performs some sort of quantitative algorithm on them – thereafter allocating each a score of “positive”, “negative” or “neutral”. That’s not really the part I use, as I already read most of the important crypto news reports (or in some cases just the headlines). The part I like are their sentiment charts:
The sentiment charts are a graphic format of the above-mentioned news analysis, as well as a chart of social media interaction.
To me, there is not that much value in tallying up number of positive or negative news stories about a coin. Obviously if a coin is, for instance, openly discovered to be a scam, then all the reports will be negative and that will be indicated as such. But in general the news reports we read tend to be subjective. It is more important for me to read the context of such information in the full news reports and to ignore the extremely large number of very poor crypto journalists out there, than what it is to see such information correlated into a single positive or negative news sentiment score. Mainstream financial journalists are notoriously poor at any form of crypto reporting.
Of much greater value is the social media score. There is a direct correlation between how often a coin is mentioned on social media and how popular it is at that time. For example: Chainlink has been trending lately, and we saw how that affected its price (even though it ended up climbing too high and “bubbling” a bit). Ravencoin would be a similar recent example.
Because markets are fickle, that which receives the attention at the time has got a far greater chance of rocketing up in price than what other coins do. For this reason, when social media sentiment on Cryptomood goes up, then one can expect the price of a coin to follow suit. Obviously the rise will not last forever. Social media trending will remain high as FUD sets in, and will continue to stay high when the bulls and bears fight each other during the inevitable price correction – so a modicum of common sense is still required when interpreting the charts.
Nevertheless, I find this feature to be very useful and it is one which most often prompts me to open my CryptoMood app.
Missed news
Though I read a lot of crypto news, I don’t read all of it. I also don’t follow every news service. Some days, when the market looks very dead (as it has done a lot of recently), I don’t even bother reading the news at all. This is when CryptoMood once again becomes very useful.
CryptoMood consolidates important news and presents it in a format that I can easily use to get myself up-to-date. It does this in various ways and you can pick which of them suits you at the time.
You can catch up on the days headlines, the latest social media posts or the trending headlines. Even better, you can select which one of the major coins you want to see news for, or you can see the news for all of them at once.
It is worth nothing that CryptoMood doesn’t have news for all the coins, but it does a good job of catering to most of the big names. You can make a Watchlist of the coins you are interested in, and then select which one you want to see news about from your homescreen. At the moment there are 18 coins to choose from. Note that the focus is definitely skewed towards the bigger name coins. For example, there will be no lack of Ethereum news, but you may struggle to find much happening in the Ontology feeds. Hopefully the smaller coin newsfeeds will be developed over time. In addition to giving you the news from your watchlist coins, CryptoMood will also tell you which coins are trending in the news, which is a useful feature in its own right.
Those are the two main things that I use CryptoMood for. But before I go, I should mention that there is a feature which allows you see the amount of crypto senton exchanges vs the amount of crypto withdrawn from exchanges to wallets in the past 24 hours. I’d be lying if I said that I used this, but for regular traders this could be invaluable information.
In conclusion
CryptoMood forms a part of the very small group of crypto apps which I keep on my phone. That alone is high praise coming from me. I suggest that you check it out if you haven’t already done so. It’s free and easy to use, so what have you got to lose?
Yours in moody crypto
Bit Brain
Attribution: all screenshots from the CryptoMood app. Available on Google Playstore.Featured image from https://cryptomood.com.
“The secret to success: find out where people are going and get there first”
~ Mark Twain
“Crypto does not require institutional investment to succeed; institutions require crypto investments to remain successful”
At this point I don’t think anyone wants to see bitcoin break the 7,600 area support. There is alot of downside potentially from there and would mean a ton of buy order got eaten up.
So after Sunday’s down move we see price floating not far from that level today and it probably makes us all sweat just a little bit.
The good news is if price can hold this level again then it becomes a rather major support in the near-term and can act as a solid bottom for a potential run higher when bitcoin is good and ready.
When that is we can only guess. The 2020 halving could provide a catalyst as price runs up into it but that is still a ways off to expect it could happen now.
In this episode our guest Adam Ernest, Representative of Liberland to the State of Colorado, discusses:
1) How his journey began through partnering with BitShares and working with Dan Larimer 2) The power of choice, and the raw essence of freedom 3) The Liberland Aid Foundation
Last year, a deep
sell-off in emerging markets and a widening domestic fiscal deficit,
exacerbated by rising oil prices, pushed the rupee down nearly 9%. This year, it’s the continued trade war
between the US and China that hurting the Indian economy and currency.
India is taken a “any
means as necessary” approach in trying to help its stagnant economy. For example, several weeks ago, India’s
Finance Minister Nirmala Sitharaman announced a cut to corporate tax rates for
domestic companies to 22%. The goal was to increase the profitability of Indian’s
publicly traded company and level the playing field of Indian companies competing
again companies in other countries with a similar tax structure. However, when a country is trying to jumpstart
their economy, there is no better tool than to cut interest rates.
India’s central bank on Friday cut its benchmark repurchase rate for the fifth consecutive time this year as it continues a concerted push to reinvigorate a stuttering economy.
The Reserve Bank of India (RBI) lowered the repo rate by 25 basis points to 5.15% with five members of its Monetary Policy Committee voting in favor, versus one who backed a 40 basis point cut.
The decision came against a backdrop of weaker growth, a resurgence of financial stability risks and a surprise fiscal stimulus in the form of a recent corporate tax cut.
More aggressive policy moves are expected, however, with the economy having deteriorated for five consecutive quarters, most recently hitting a six-year low of 5% in the second-quarter of 2019.
Monthly Chart (Curve Time Frame) – monthly supply is 73.500 and monthly demand is 63.500.
Weekly Chart (Trend Time Frame) – the trend is sideways.
Daily Chart (Entry Time Frame) – the price has reacted to both supply zones, and has the potential to go much lower, but the chart suggests price has to close below the pivot low for confirmation first that price will go a lot lower.
This post is my personal opinion. I’m not a financial advisor, this isn’t financial advise. Do your own research before making investment decisions.