? Daily Crypto News, August, 5th?

  • Bitcoin’s Price Jumps Back Above $11K for the First Time In 3 Weeks ;
  • Bitcoin SV Splits Into Three Chains Following 210 MB Block ;
  • Bitcoin’s Computing Power Sets Record as Over 100K New Miners Go Online ;
  • Keiser: Bitcoin Could Cross $15,000 This Week, No Trust in Centralization ;
  • Crypto Market Risk Rises as Tether Migrates to More Blockchains ;
  • ? Daily Crypto Calendar, August, 5th?
  • STEEM Trading Update

Welcome to the Daily Crypto News: A complete Press Review, Coin Calendar and Trading Analysis. Enjoy!

? Bitcoin’s Price Jumps Back Above $11K for the First Time In 3 Weeks

Bitcoin (BTC) has risen back above $11,000 after regaining ground lost on July 8 and July 22, when the world’s largest cryptocurrency by total value suffered bearish breakdowns that sent its price below $10,000.


At 15:00 UTC on August 4, bitcoin rose above $11,000 for the first time in 21-days.


BTC’s price stalled and then was retested along the $10,600 area on Aug. 4, proceeded by a breakout above $11,000, 10 hours after its most recent sell-off. BTC was last seen changing hands at $11,227 after a strong hourly candle broke above $11,050.


? Bitcoin SV Splits Into Three Chains Following 210 MB Block

Following a recent hard fork of Bitcoin SV (BSV), the network saw a three-chain split after a massive 210 megabytes (MB) block was mined.


As reported by BitMEX Research on Aug. 3, Bitcoin SV nodes divided into three groups on Saturday, making the network to split into three separate chains. According to the report, 65% of nodes were located on the current tip, while 17% were stuck on the 210 MB  block and 19% had not even upgraded and were on the old pre-hard fork chain.

Bitcoin SV node chart.

According to data from Coin Dance, the 210 MB block was mined on Aug. 3 by CoinGeek miner and involved 808,633 transactions.

Bitcoin SV, a hard fork of Bitcoin Cash (BCH), which is in turn a fork of the major cryptocurrency Bitcoin (BTC), successfully ran its own scheduled hard fork on July 24 as part of plans to increase its block size from the previously set limit of 128 MB up to 2 gigabytes.

? Bitcoin’s Computing Power Sets Record as Over 100K New Miners Go Online

The total computing power now dedicated to securing the bitcoin blockchain has set yet another record.


According to data from mining services operator BTC.com, the average bitcoin mining hash rate over the last two weeks has reached 71.43 quintillion hashes per second (EH/s), up from 64.49EH/s on July 23. The threshold was breached as bitcoin adjusted its mining difficulty at block height 586,672 on Monday 2:52 UTC – that is a 6.94EH/s, or 10.78 percent jump since mid July. 


Bitcoin mining difficulty is a measure of how hard it is to compete for mining rewards on bitcoin. Just how difficult the bitcoin software makes it to generate new blocks adjusts every 2,016 blocks – approximately every 14 days – to ensure the block production time remains about 10 minutes at the next cycle.

? Keiser: Bitcoin Could Cross $15,000 This Week, No Trust in Centralization

Max Keiser, a former Wall Street trader and host of the RT program Keiser Report, said that he believes Bitcoin (BTC) will break $15,000 this week.


In tweet published Aug. 3, Keiser said that he is “sensing #Bitcoin will cross $15,000 this week.” He further stated that confidence in central governments, central banks and centralized fiat money are at the lowest level they have been in decades. He noted:


“I’m confident. So I just burned another $10,000 in $USD shitcoin. Correlation does not equal causation, but whenever I burn a few thousand $USD, BTC price goes up significantly.”

? Crypto Market Risk Rises as Tether Migrates to More Blockchains

One of the murkier corners of the cryptocurrency market is becoming even less transparent.


Tether, the controversial token that serves as a conduit for trading coins on many of the world’s largest crypto exchanges, is becoming the means for conducting transactions on a spate of new blockchains, the distributed digital ledgers that underpin the digital assets.


The migration from the dominant Bitcoin and Ethereum platforms risks making it more difficult for investors to track transactions, going against one of the key tenets championed by crypto advocates since the advent of the self-styled alternatives to money a decade ago.

image.png

? Daily Crypto Calendar, August, 5th?

Coinbase Pro begins accepting XTZ deposits for 12 hours prior to enabling full trading.

ERC-1155 support is coming to 0x protocol on August 5.

SWIPE IEO on Tokenomy from August 5th to 18th. Purchasing with TEN yields 10% bonus.

“ETH and Neo Sidechains are scheduled to be deployed on the #Elastos Mainnet for whitelisted partners and developers starting August 5th.”

“At the start of every month, we will be taking snapshop of all EthereumX token holders with more than 300,000 ETX tokens.”

image.png

STEEM Trading Update by my friend @cryptopassion

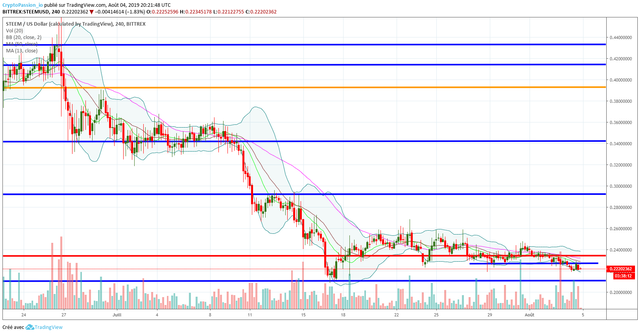
Here is the chart of yersterday :
STEEMUSD.jpg

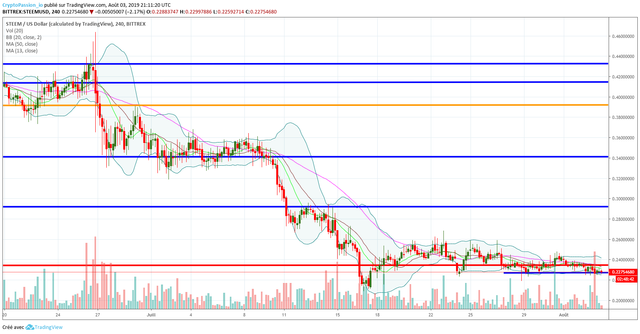
Here is the current chart :

STEEMUSD.jpg

So yeah my friends, except if we have a sudden big up in the coming hours, the support line at 0.24 and the little support just under in blue can be considered as broken. We should now go in the direction of the support line at 0.21$ which is a major support line which hold us since december 2018. If we break that support… I really don’t know where we will stop… 0.15$, 0.1$, 0.05$, 0.01$? what would be the minimum for you ? Let’s share your opinion.

image.png

Last Updates

image.png

Join this new Free To Play on the STEEM Platform !

Liberland show

In this episode we interview three dynamic Liberland associates that are attending FreedomFest 2019:

1) Salvatore Flight (linkedin.com/in/salvatore-flight-52870b120)
2) Ned Piplovic (linkedin.com/in/nedpiplovic)
3) Josh Sigurdson (linkedin.com/in/josh-sigurdson-67a48a116)

More information: www.freedomfest.com

Follow the Liberland Show:
iTunes: itunes.apple.com/us/podcast/liberland-show/id1442988844…

Spotify: open.spotify.com/show/6oGiaY901GlfWbaFqgEEaF

Google Podcasts: https://www.google.com/podcasts?
feed=aHR0cHM6Ly9hbmNob3IuZm0vcy83YzY0ODFjL3BvZGNhc3QvcnNz

*Our show is hosted by Adam J. Carswell.

Bitcoin Rallies to Resistance – Will it Fail?

Bitcoin has had a slow and rather quiet move higher over the past few days.  That is until today where volume has picked up in the past few hours and price pushed more than 600 points.

11,600 has been a pivot point before

Looking at the chart you can see price has come up to this level in the 11,600 area.  With price now getting a but extended from the 10 day moving average and volume being somewhat low for this move on a whole it would not be a surprise if the up move died in this area.

However, if that were to happen then some sideways to slightly lower consolidation would be bullish.

To be honest as long as it maintained above 10,800 while the moving average caught up I’d be happy with the price action.

We shall see what the coming days will bring….

Forex $1 MM Challenge (8/4/19) – Recent Japanese Yen Trades

Safe havens currencies retain or increase in value during risk off environments, meaning when economic turbulence is upon us. Three major safe haven currencies are the U.S. dollar, the Japanese Yen and the Swiss Franc.  In the past several months we have witnessed a divergence in the equity markets.  While all major equity markets around the world are doing down, the US market is the only one holding on for dear life. So in a risk off environment commodity type currencies decline in price as a result.

On July 1st I when short two different Japanese forex pairs.

Forex $1 MM Challenge – Trade #16 (7-1-19) Sold USD/JPY

Monthly Chart (Curve Time Frame) – monthly supply is at 121.00 and monthly demand is at 97.000.

Daily Chart (Entry Time Frame) – the chart suggests to go short at the daily supply at 108.60.

NOW – Price stopped me out before pushing lower this past week.

Forex $1 MM Challenge – Trade #17 (7-1-19) Sold CAD/JPY

Monthly Chart (Curve Time Frame) – monthly supply is at 0.05600 and monthly demand is at 0.04600.

Daily Chart (Entry Time Frame) – the chart suggests to short price at the daily supply at 78.000.

NOW – this trade is still in play at this time.

Both trade set-ups were a Reward to Risk of 5:1. So although I was stopped out on the USD/JPY, if the CAD/JPY ends up hitting my target, my account will go up 4%.

The game of trading is a probability game, which you most trades have less than a .500 batting avg (win/loss ratio). However, as long as your avg win is greater than your avg loss, your equity curve should be positive. Let me illustrate, if my avg. win is 3X my avg. loss, all I need is a minimum win % of 25% to be profitable. And if your avg. win was 20X your avg loss, you only have to be right 5% of the time. This is why I stopped sweating my losses years ago because my losses lead to my wins. Until next time.

My Journey Into Forex – Part 3 of 3 (The $1 MM Challenge) – Part 2

This post is my personal opinion. I’m not a financial advisor, this isn’t financial advise. Do your own research before making investment decisions.

Cryptocurrency Relative Strength Analysis Report For Week Starting 8/4/19

When you think about Cryptocurrencies, one name immediately comes to mind, Bitcoin.  Since the creation of Bitcoin, there has only ever been one cryptocurrency at the top of the market cap rankings…Bitcoin. 

When the price of Bitcoin rises, generally you can expect altcoin prices to rise with it. Likewise, when the Bitcoin price drops, altcoins also follow. And sometimes when Bitcoin is rising, the altcoins are declining due to cash moving from the altcoins to Bitcoin and vice versa.

Source Image

Bitcoin dominance is used to measure the percentage of the cryptocurrency market that can be attributed to Bitcoin. Thus, it’s very easy to determine the relative strength of Bitcoin at any point. Not the case for the altcoins…until now. I have taken the more popular altcoins and determined their relative strength, relative to Bitcoin using just moving average.

Binance

EOS

Ethereum

Litecoin

Neo

Steem

Tron

Zcash

Based on the moving averages and the last daily closing price, relative to the moving averages,

the altcoins relative strength, relative to Bitcoin are the following:

This image has an empty alt attribute; its file name is image-317.png

Two Weeks Ago

This post is my personal opinion. I’m not a financial advisor, this isn’t financial advise. Do your own research before making investment decisions.

Total Market Decision Point

Putting aside what BITCOIN is doing lately, it is worth to check as well what the TOTAL crypto market does.

It is a fact that BITCOIN is being feed mainly by the altcoins in the present days since doesn’t look that “fresh” FIAT is entering at the market nowadays, that’s why looking at the BITCOIN chart versus USD can be a little bit misleading since there is a lot of selling pressure for BTC by the altcoins side

However, as I wrote yesterday in this post an enormous Bullish Flag has been formed as well at the Total Cryptocurrency market.

Inside this Bull flag there is a count that will fit in and may give you some hopes regarding the end of the correction is probably done. It is a Regular Flat Correction (3-3-5)


The only “but” I see in this possibility is that, in order to be considered as a “Regular Flat correction”, “B” should be just below the start of wave “A”, and, it is but perhaps so much low…

Anyway, let’s consider this count as good, if so, then the correction should be already finished and the Total Crypto Market should has finished already the first wave upwards and working on the third and more powerful wave, something like the following:


Nevertheless, as I said yesterday with the BITCOIN chart, a Bull Flag can promote at least 5 rebounds between its confining lines:


Conversely to BITCOIN’s Volume, the TOTAL MARKET Volume has decreased from the top of the year but not so much compared with the Crypto King and what I see in the Daily RSI indicator is an excellent situation for higher highs:

So, yes, IMO we are now in an important moment according to the Total Market Chart, be ready to experiment a possible sudden Price action, mostly on BITCOIN but also in other big Altcoins afterwards.

Enjoy!


Disclaimer: This is just my personal point of view, please, do your own assessment and act consequently. Neither this post nor myself is responsible of any of your profit/losses obtained as a result of this information.


US Interest Rates Analysis Report 8/4/19 – Rates Will Continue To Go Down

The Fed Powell cut interest rate this past week because the Markets demanded it, Trump has been blasting Fed Powell about lowering rates and to keep the party going.  But don’t expect your interest rate on your credit card or car note to go down. The interest rate cut was the federal funds rate that was cut, meaning the rate banks charge each other over short periods.

The last time I spoke about rates, specially the 10 yr bond rates was in May,

US Interest Rates Analysis Report 5/20/19 – Are Rates Eventually Going Higher???

On the monthly chart price breached the up trendline to the downside in December and currently sits in the monthly demand zone at 2.322%.  Interest rates might go up in the short term,

but my bias is that rates will go down longer term because of the macro picture.

In addition to the rate cut, the news of more tariffs on Chinese goods and continued weak US PMI manufacturing data this past week,

Source

the yield on the 10 yr bond is now below 2%. This is a really big deal, because we haven’t seen rates this low in years, a testament that the economy is slowing down and a recession is right around the corner (I’m targeting May of 2020, but by that time, the Markets might be down 20%-30%). So while Fed Powell is saying don’t expect more rate cuts, he won’t have a choice but to continue to cutting rates.

This post is my personal opinion. I’m not a financial advisor, this isn’t financial advise. Do your own research before making investment decisions.

My Take On The US Equity Markets For The Week Of 8/5/19

This past week, Fed Powell cut rates…as expected.  Markets will typically rally after a rate cut due to lower borrowing cost for companies, translating into higher profits.  And we did get a rally, until Trump twitted an additional 10% tariffs on the remaining $300 million of imports from China.  That twit alone lead to a 700 pt reversal in the Equity Markets and the stocks closed at a level not seen since late June.

S&P 500 – Big Picture

Lets Zoom In

Price fell back into a daily demand on Friday. Although price reacted to the zone, I don’t know if there are enough buyers to take out the sellers. The zone is no longer fresh and the chart suggests price will fall further down to 2890.

DOW Big Picture

Lets Zoom In

There is a major support/resistance line band near 21000.

I think there is more downside risk as I’m looking for price to fill the gap and react to the daily demand at 21000.

Nasdaq – Big Picture

Lets Zoom In

Daily demand is about 200 points lower.

However, on the 4 hr hour chart, there is a 4 hr daily demand that I would of taking long, but it was a Friday and I didn’t want price to potential gap against me on Sunday. So going into Monday, if prices hold, after I see some potential strength, I will look to go long on a pull back on a 15 min chart.

NOTE: the better 4 hr demand zone is lower because it represents more of a discount and embedded within a daily demand zone.

Russell 2000 – Big Picture

Lets Zoom In

Prices remain sideways, the only way to play the Russell is to play the extremes as indicated on the 4 hr chart.

This post is my personal opinion. I’m not a financial advisor, this isn’t financial advise. Do your own research before making investment decisions.

Germany expanding digitisation with the new Digital Care Act

Germany
expanding digitisation with the new Digital Care Act (Health Europa)

  • Germany has introduced the new Digital Care Act, which builds upon the 2016 ‘E Health Act’ that focused on developing information and communication technology in healthcare, particularly in the form of ‘electronic health cards’ and ‘electronic patient files’.
  • The new Digital Care Act will enable doctors to prescribe health apps, the cost of which, under certain conditions, will be reimbursed by German statutory health insurances.
  • Additionally, the German Act that currently prohibits the advertising for remote consultations will be amended, and any planned regulations of the introduction of the ‘electronic patient file’ have been removed, in order to facilitate its launch at the turn of the year 2020/2021.

Analysis and Comments

  • The electronic health card serves as an insurance card for people with statutory health insurance, while the electronic patient file (which hasn’t been built yet) is a further development of the card.
  • The file will enable statutory health-insured people to access a broad range of medical information such as, for example, findings, diagnoses, therapy measures, treatment reports, and vaccine history.
  • A separate privacy law governing the sensitive health data that is to be recorded in the electronic patient file is due to come into effect in January 2021.
  • Ultimately, the new law simply recognises the fact that patients have already been using health apps of various kinds, and stresses Germany’s intent to introduce digital services such as the electronic patient records as soon as possible.
  • Australia recently introduced a similar patient file called ‘My Health Record’, which apparently not only many Australians have opted out of, but is currently often empty (i.e. not being used as information is not being shared in a meaningful way between all parts of the system).