
Another Test Post

Another Test Post

The financial theme in 2019
has been the inverted yield curve. Why
is it so important…it’s only predicted the 5 or 6 recessions, meaning it has
given no false signals going back 50 years.
Another signal of a pending recession came last week when the US purchasing-managers
index contracted to 49.9 in August from 50.4 in July, the first such shrinkage
in almost 10 years.
The discussion of inverted yield curves is so important that I decided to repost my post on the topic from more than a year ago…withouth further ado.
A bond is like an IOU given to you by a bank. When you lend the bank money, they’ll give you back that same amount at a later time along with a fixed amount of interest. For example, if you bought a two-year bond for $100 with a 2% annual return on it, you get $104.04 back after two years. Bonds have a number of benefits that justify the small rate of return. Government bonds are stable investments and bonds issued by the US government have never defaulted…YET.
The term yield curve refers to the relationship between the short- and long-term interest rates of fixed-income securities issued by the U.S. Treasury. Typically, short-term interest rates are lower than long-term rates reflecting higher yields for longer-term investments due to the higher risks associated with long dated maturities. Also, in a growing economy, investors demand higher yields at the long end of the curve to compensate for the opportunity cost of investing in bonds versus other asset classes.
As the economic cycle begins to slow, the upward slope of the yield curve tends to flatten as short-term rates increase and longer yields stay stable or decline slightly. As concerns of an impending recession increase, investors tend to buy long Treasury bonds as a safe harbor from falling equities markets. As more and more investors begin to buy long-term bonds, the Federal Reserve lowers the yield rates. Since investors aren’t buying a lot of short-term U.S. Treasury bonds, the Fed will make those yields higher to attract them. Eventually, the yield on short-term bills rises higher than the yield on long-term bonds, and the yield curve inverts.

The inverted yield curve is the single greatest indicator of a coming bear market. The inverted yield curve has predicted the past 5 recessions going back to the late 1970’s. Every time the yield curve turns negative, a recession has occurred in the near future. Since 1956, equities have peaked six times after the start of an inversion in the yield curve and the economy has fallen into recession within seven to 24 months.

The most recent inverted yield curve first appeared in August 2006, as the Fed raised short-term interest rates in response to overheating equity, real estate and mortgage markets. The inversion of the yield curve preceded the peak of the S& P 500 in October 2007 by 14 months and the official start of the recession in December 2007 by 16 months, eventually leading to the Great Recession in which the S&P 500 dropped 50%.

This next inversion is upon us right now. Based on history, I’m predicting the yield curve will invert by the end of the year, the Markets will peak in 2019 and we will be in a recession in 2020 (a period of temporary economic decline during which trade and industrial activity are reduced, generally identified by a fall in GDP in two successive quarters).

However, this time around balance sheets of the Fed and Treasury extremely over leveraged right from the start. Our national debt over $20 trillion dollars and the Fed’s balance sheet at $4.5 trillion. Thus, when the yield curve inverts for the third time this century, you can expect unprecedented chaos in markets and the economy to follow shortly after because the yield curve will not only invert at a much lower starting point than at any other time in history. This represents a huge opportunity for those that can identify these inflection points and know where to invest. Be sure I will be here to tell you those opportunities and how to protect your capital.
Wall Street Secrets Revealed #7 – The Greenshoe Option – Part 2
Wall Street Secrets Revealed #7 – The Greenshoe Option
Wall Street Secrets Revealed #5 – Timing The Next Market Crash Using Margin Debt As An Indicator
Wall Street Secrets Revealed #4 – The Inverted Yield Curve…The Greatest Recession Predictor
Wall Street Secrets Revealed #3 – Timing The Next Stock Market Crash
Wall Street Secrets Revealed #2 – Did You Buy The Milk This Week??? – Part 2
Wall Street Secrets Revealed #1 – The Hedge Funds Are Coming To Crypto – Part 2
Wall Street Secrets Revealed #3 – Why The Market Went Down 10%
Wall Street Secrets Revealed #2 – Did You Buy The Milk This Week???
Wall Street Secrets Revealed #1 – The Hedge Funds Are Coming To Crypto
This post is my personal opinion. I’m not a financial advisor, this isn’t financial advise. Do your own research before making investment decisions.

Berenberg view


Chat with your friends – and get paid to do it.
The Stellar Development Foundation and messaging service Keybase announced Monday a 2 billion XLM airdrop, the largest in Stellar’s five-year history, worth roughly $120 million. Over the next 20 months, Keybase users can expect monthly airdrops of 100 million XLM.
Keybase currently has 300,000 active users across its various services, according to the company.
“All you have to do is have an authenticated Keybase account, and your XLM will appear in your wallet – automatically, every month, for as long as the airdrop continues,” according to a draft blog post shared with CoinDesk.
The popularity of the decentralized blockchain-enabled web browser Brave continues to grow as it has outranked other browsers in Google Play rankings in Japan.
Brave beats rival browsers
According to a Reddit post on Sept. 8, this is the first time that the privacy-focused Brave browser has overtaken its rival browsers such as Firefox, Opera and Chrome in Japan. The most recent ranking data from Google Play shows that Brave sits comfortably at number 10 on the list, while its closest competitor Firefox lags behind, occupying 14th place.
A Google Play ranking is determined by how well apps perform against several key metrics such as crash rates, app-not-responding rates, excessive WiFi, location or processing in the background.
IBM has doubled the number of its employees on the technical steering committee (TSC) of Hyperledger, stoking concerns about the tech giant’s influence on the enterprise blockchain consortium.
Six out of the 11 2019-2020 TSC members announced last week are IBM employees. Five work at Big Blue itself and one, Mark Wagner, is a senior principal engineer at Red Hat, an IBM subsidiary. By comparison, the previous year’s TSC had only two IBM representatives and the same number of total seats (Wagner served on the committee, but IBM’s acquisition of Red Hat did not close until July 2019).
The new committee will begin governing after the new TSC chair is elected next week.
Investment management firm VanEck has issued just 4 bitcoins (BTC) via its new trust focused on institutional investors.
VanEck: one week, one Bitcoin basket
Data from the company, spotted by economist and cryptocurrency commentator Alex Krüger on Sept. 10, showed that since its launch at the start of the month, VanEck SolidX Bitcoin Trust 144A Shares total net assets are only $41,400.
The product, which caused a buzz after VanEck described it as being akin to an exchange-traded fund (ETF), caters strictly to so-called qualified institutional buyers, or QIBs.
“VanEck SolidX Bitcoin Trust 144A Shares… looks and feels like a traditional ETF,” its official description reads.
Fresh data from the Japan Virtual Currency Exchange Association (JVCEA) has revealed that as of April 2019, the value of yen-denominated Bitcoin (BTC) holdings has outstripped those in XRP on domestic exchanges.
As Cointelegraph Japan reported on Sept. 10, the surge in the value of exchanges’ Bitcoin holdings coincides with the beginning of Bitcoin’s 2019 bullish uptrend, which saw the top cryptocurrency hit close to $14,000 by late June.

More XRP is being accumulated, but value declining

“We are happy to share with the community our dApp Testnet release on September 10th.”
David Atkinson at The Blockchain Centre at 7:00 PM in Singapore.
“At 1pm UTC on 10 September CEO @HMsheikh4 will be answering questions on @coin98_net’s Facebook page.”
“Gathering the key players in the blockchain space in town to discuss adoption, decentralized applications & financial systems”
Perth Meetup
Here is the chart of yersterday :
Here is the current chart :
The zone around 0.165$-0.164$ starts to be a support zone and even we tried to break it several times, it looks like that the sellers have difficulties to go lower. We have the see what will be the results in the coming hours as we are just sitting on it but a UP bounce from that zone is possible.
Last Updates
Join this new Free To Play on the STEEM Platform !


It was June of 2017, I was new to crypto (still new today but thats another story) and I saw a coin mentioned in a chat room somewhere, thought it might be a good tip so I grabbed some at the price of 8322 satoshi’s.
They were tumultuous times as the coin got pumped and dumped a few times. Fortunately fo me I managed to take advantage of some of the pumps.
Then came an end to the altcoin season and pretty much all altcoins entered the downward spiral that we hopefully are near the bottom of now. I thought it was just a dip, so used some of my profits to buy more EXCL, then more, then more, until I had no BTC left to plough back into the coin. It kept dropping in price though…
So I walked away, for almost a year.
When I logged back into the exchange my coins were worthless, what to do, liquidate and get back a fraction in BTC terms? At this point I actually did some reading about the coin, better late than never I guess.
So, turns out it is a proof of stake coin, now I am not keen on running a wallet locally so turned to BTCPOP (affiliate link) as I had made use of their staking service before with some RDD.
As luck would have it, they had an EXCL wallet and staking was as simple as depositing the coins and waiting. In the end it was a good choice dropping the coins off there instead of doing my own wallet because EXCL did a swap, which I would not say went well, BTCPOP handled the swap and I did not have to do anything, staking was just disabled while their wallet caught up.
Obviously there is the saying ‘not your keys, not you coins’ and the same applies to BTCPOP as it does with any other exchange.
As of right now I am still down to a fraction of the value in BTC that I put in, but who knows, maybe the next rally is right around the corner?
No EXCL? That’s ok BTCPOP also has a faucet, that you can claim from after you register on the site! https://btcpop.co/Faucet/?ref=82381

Cosmo Coin (Bittrex: COSMBTC) has broken out of the triangle pattern in the four-hour chart.

(Chart courtesy of Tradingview.com (log scale))
Elliott Wave Analysis
In Elliott Wave terms, Cosmo Coin began a wave one advance on September 3. The red wave one (blue sub-waves i-ii-iii-iv-v) finished on September 6, and the red wave two (blue sub-waves a-b-c) correction ended on September 9. If this wave count is correct, Cosmo Coin should be heading next towards the September 6 peak in the red wave three.

(Chart courtesy of Tradingview.com (log scale))
Zooming out in the daily chart, I believe Cosmo Coin is currently in the red wave three (blue sub-wave iii). The red wave three began on September 3.

(Chart courtesy of Tradingview.com (log scale))
Funnymentals
Cosmochain is designing a blockchain-based beauty ecosystem that connects beauty industry players with customers willing to share their thoughts on cosmetics. You can watch their intro video below.
(Sources: Cosmo Coin and YouTube)

How can I vote? Where is the contest?
You can vote by following this link.


MTL seen from the temporality of 1D we can observe that the current structure has formed a bullish pennant and the major figure shows an inverted SHS, a reversal pattern of trend, in the chart above I have indicated the pennant through the diagonals in light blue, while the diagonals of trend and horizontal supports are in dark blue, previously the price made an upward journey recovering the support located at 0.000035 and consolidate above that level, it would be expected that the price continues its upward path, currently the candles are testing the diagonal of the bearish wedge within the pennant, if we fail to make the break in the current situation, we could expect a reversal to the diagonal greater, approximately within the price range of 348 – 358, to then have a pullback to break the resistance of the figure and reach our pennant target, which is at 485, I have also pointed out in the chart above the SHS target, which is higher located at 629.

MTL seen from the temporality of 4H we can observe more closely the current movement of the candles, we can observe how it has tested the resistance of the descending wedge, within the circles I have pointed out the important points that we should always take into account in a trend, the third circle has not yet been completed, so I mentioned earlier that we could see a reversal to the diagonal that would end the down cycle and look for the break.
In conclusion, MTL has a good enough chart to trade, the major figures are bullish, the price has recovered an important level, located above the previous LL, the neck line I have indicated in the chart with purple color, in the short term we could see fulfilled the objective of the pennant, found resistance in the neck line, so we should see another accumulation to go for the objective of the SHS achieving the breakage of the neck line first. I recommend to be very attentive to the action of the price in 4H and the closing in 1D, also always be attentive to the movement of BTC, since any strong movement can affect the market of the alts.
As I always say, you have to be aware of the movement, invalidations can occur, there is no 100% reliable analysis, take your own precautions when trading.
You can follow me on Twitter: https://twitter.com/armijogarcia

yep, I know what you think right now… this may be just another post trying to bring positive vibes on our beloved STEEM… but definitely, no matter which pair you check right now compared with STEEM, all of them are showing signs of reversal according to a DIVERGENCE on the Daily RSI.
For me the most important currently is to compare STEEM vs BITCOIN on the daily chart and this is what we see today:

During one month STEEM has been ranging between 1550 and 1800 Satoshis, with a light descending trend in overall but with a clear divergence on the RSI
Same is happening if you compare the second most important pair, STEEM vs ETHEREUM:

…and also STEEM vs BINANCE COIN:

The conclusion that I get by observing these three charts and respective divergences on RSI is that STEEM is timidly getting stronger in front of their competitors. worth to say that just around one month ago, STEEM was placed on the 88th position of the Total Market Cap….

… while today, even if the total cap of STEEM has decreased since then, we can see STEEM at the 79th and sometimes reaching below that place:

We can also see that change of trendline if we compare STEEM vs USD:

The price of STEEM is ranging between 0.16 and 0.19 USD since weeks already, RSI is also behaving very similar to the other pairs but, of course, the way the price is decreasing here, in USD, depends at the 95% I would say, to what is going to do BITCOIN in the coming days…
If BTC falls, which is very likely according to my expectations, the complete altcoin market will suffer another hit versus the dollar, included STEEM as well…
…the only thing different here is that STEEM may have reached its bottom versus BITCOIN while others not…
Disclaimer: This is just my personal point of view, please, do your own assessment and act consequently. Neither this post nor myself is responsible of any of your profit/losses obtained as a result of this information.

After a long time and copious amounts of work and time I managed to get the kitchen finished. I would not say that I am super happy with the result, but much of the worst parts are hidden by a cupboard so it’s not noticeable how bad a job I did with the plastering…
When my wife explained to my mother-in-law I was taking a photo for a blog, she insisted that she had to be in the photo, so there she is, posing in her kitchen!
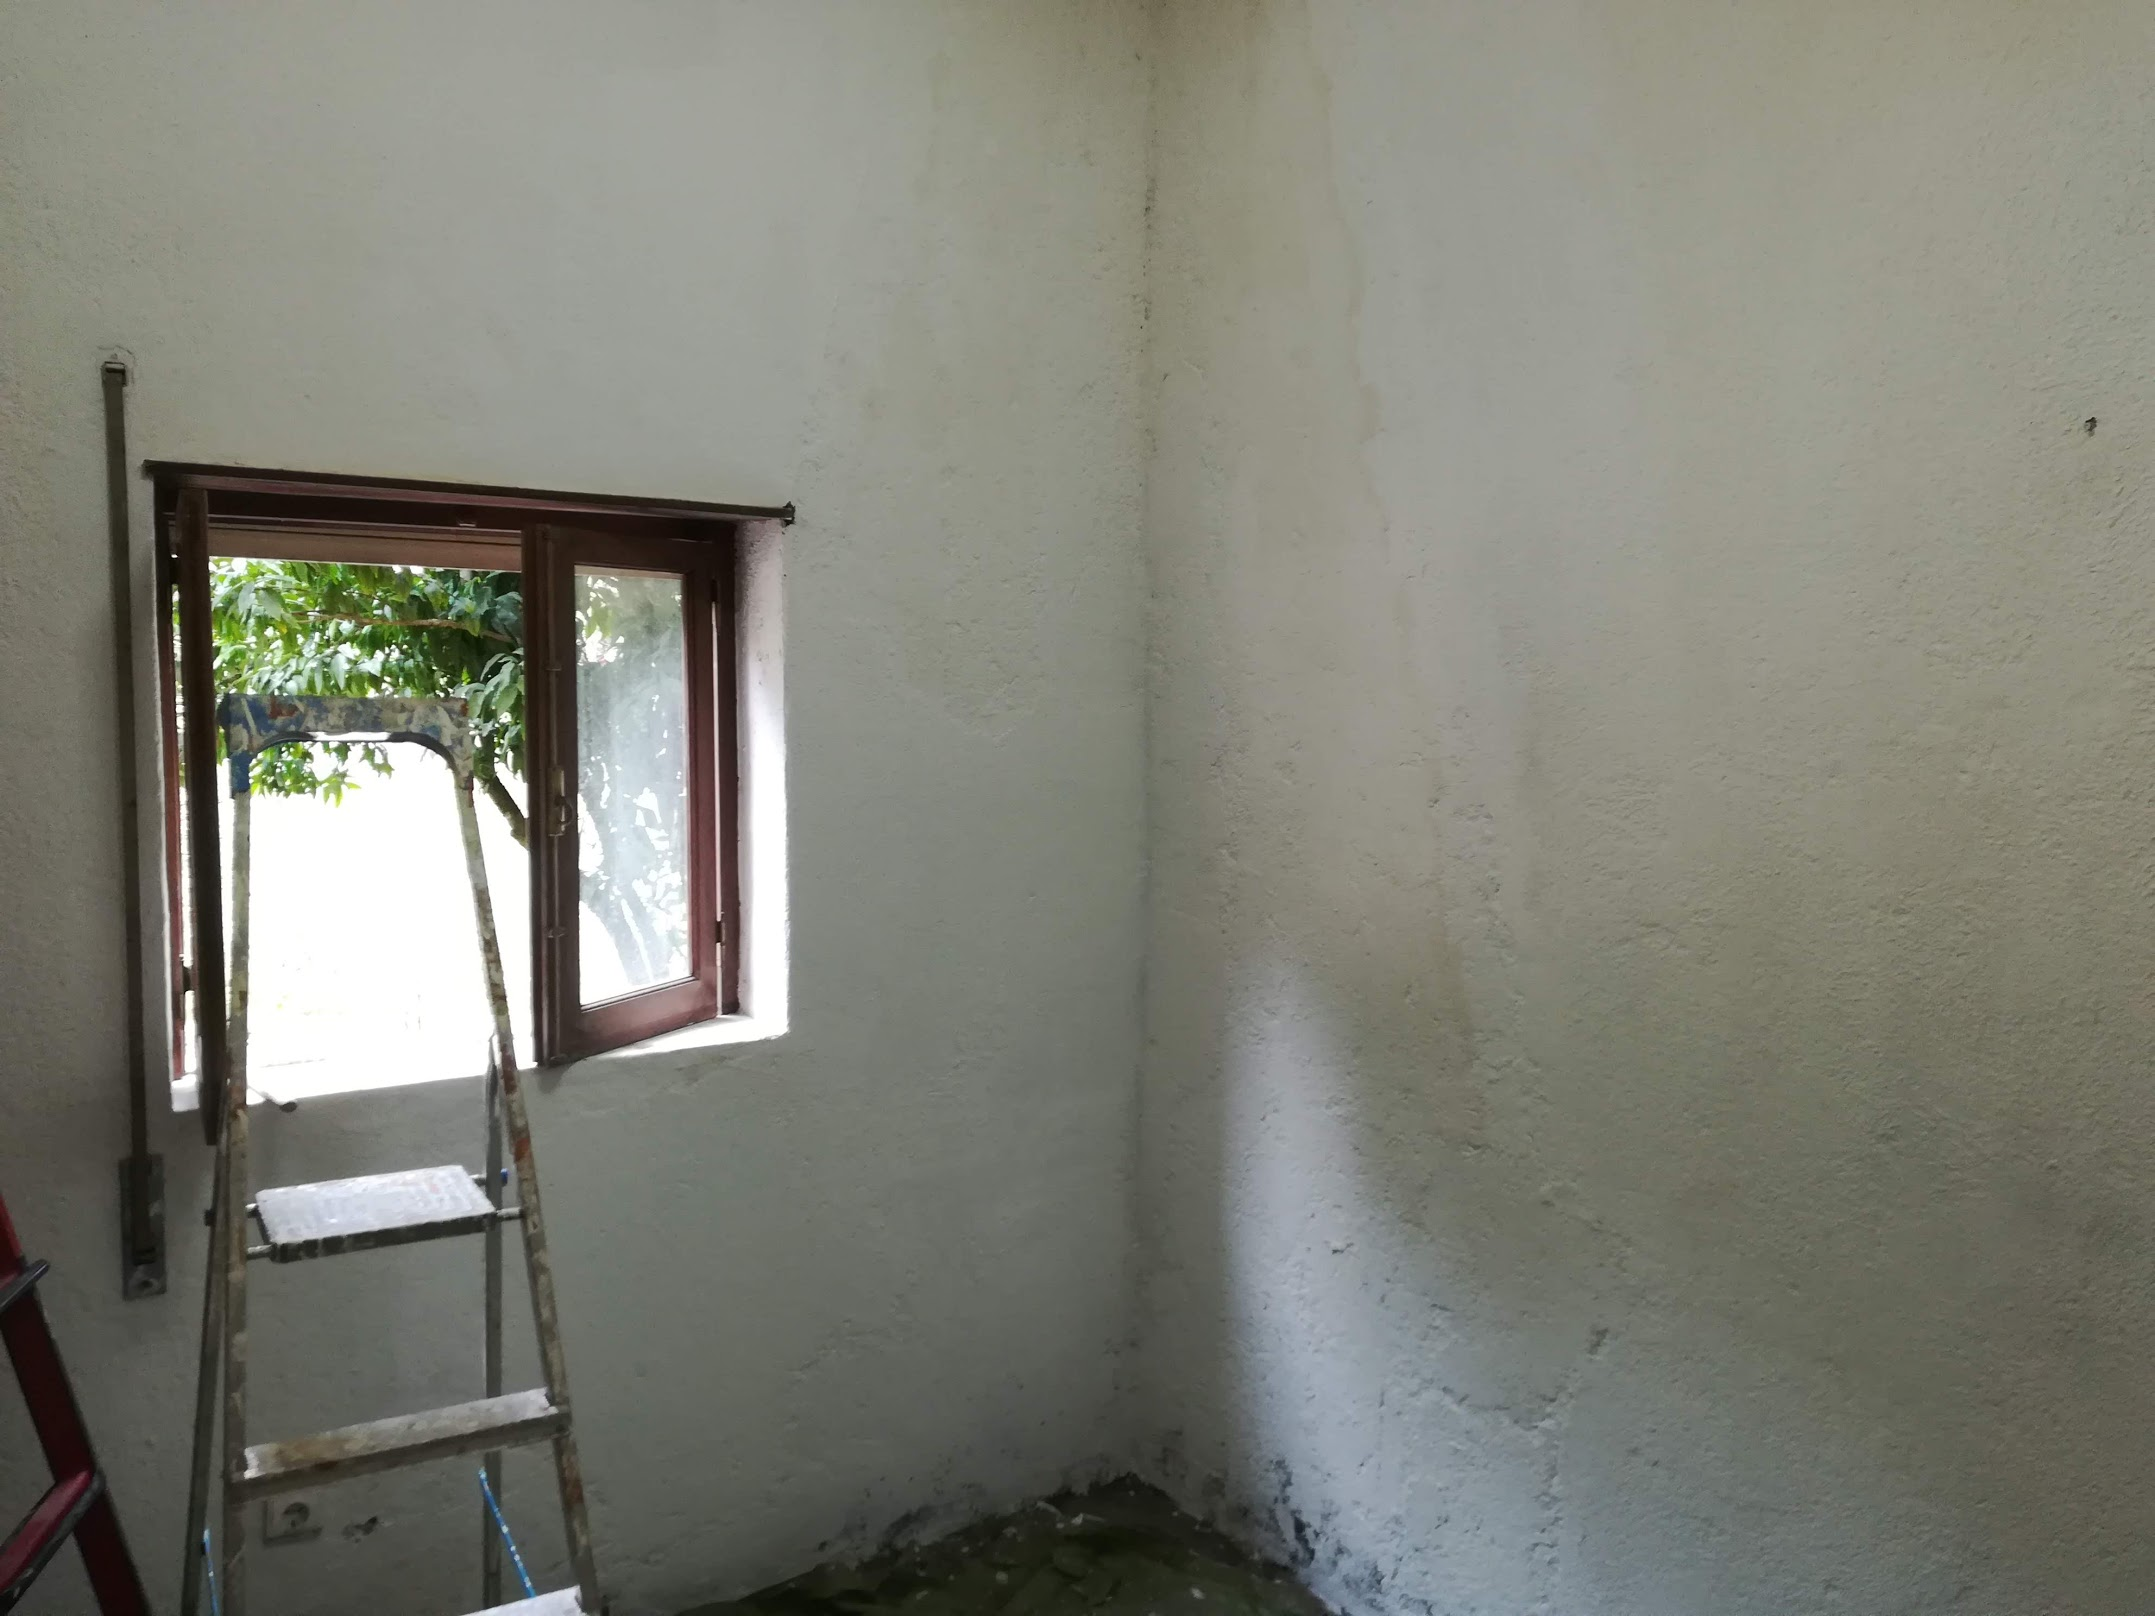
With all the soot that was on the wall, every coat of paint I put on would end up with the outline of the inside of the fireplace bleeding through. I had no choice but to keep applying layer after layer of undercoat, so that when I painted with the final paint it would not be so obvious.
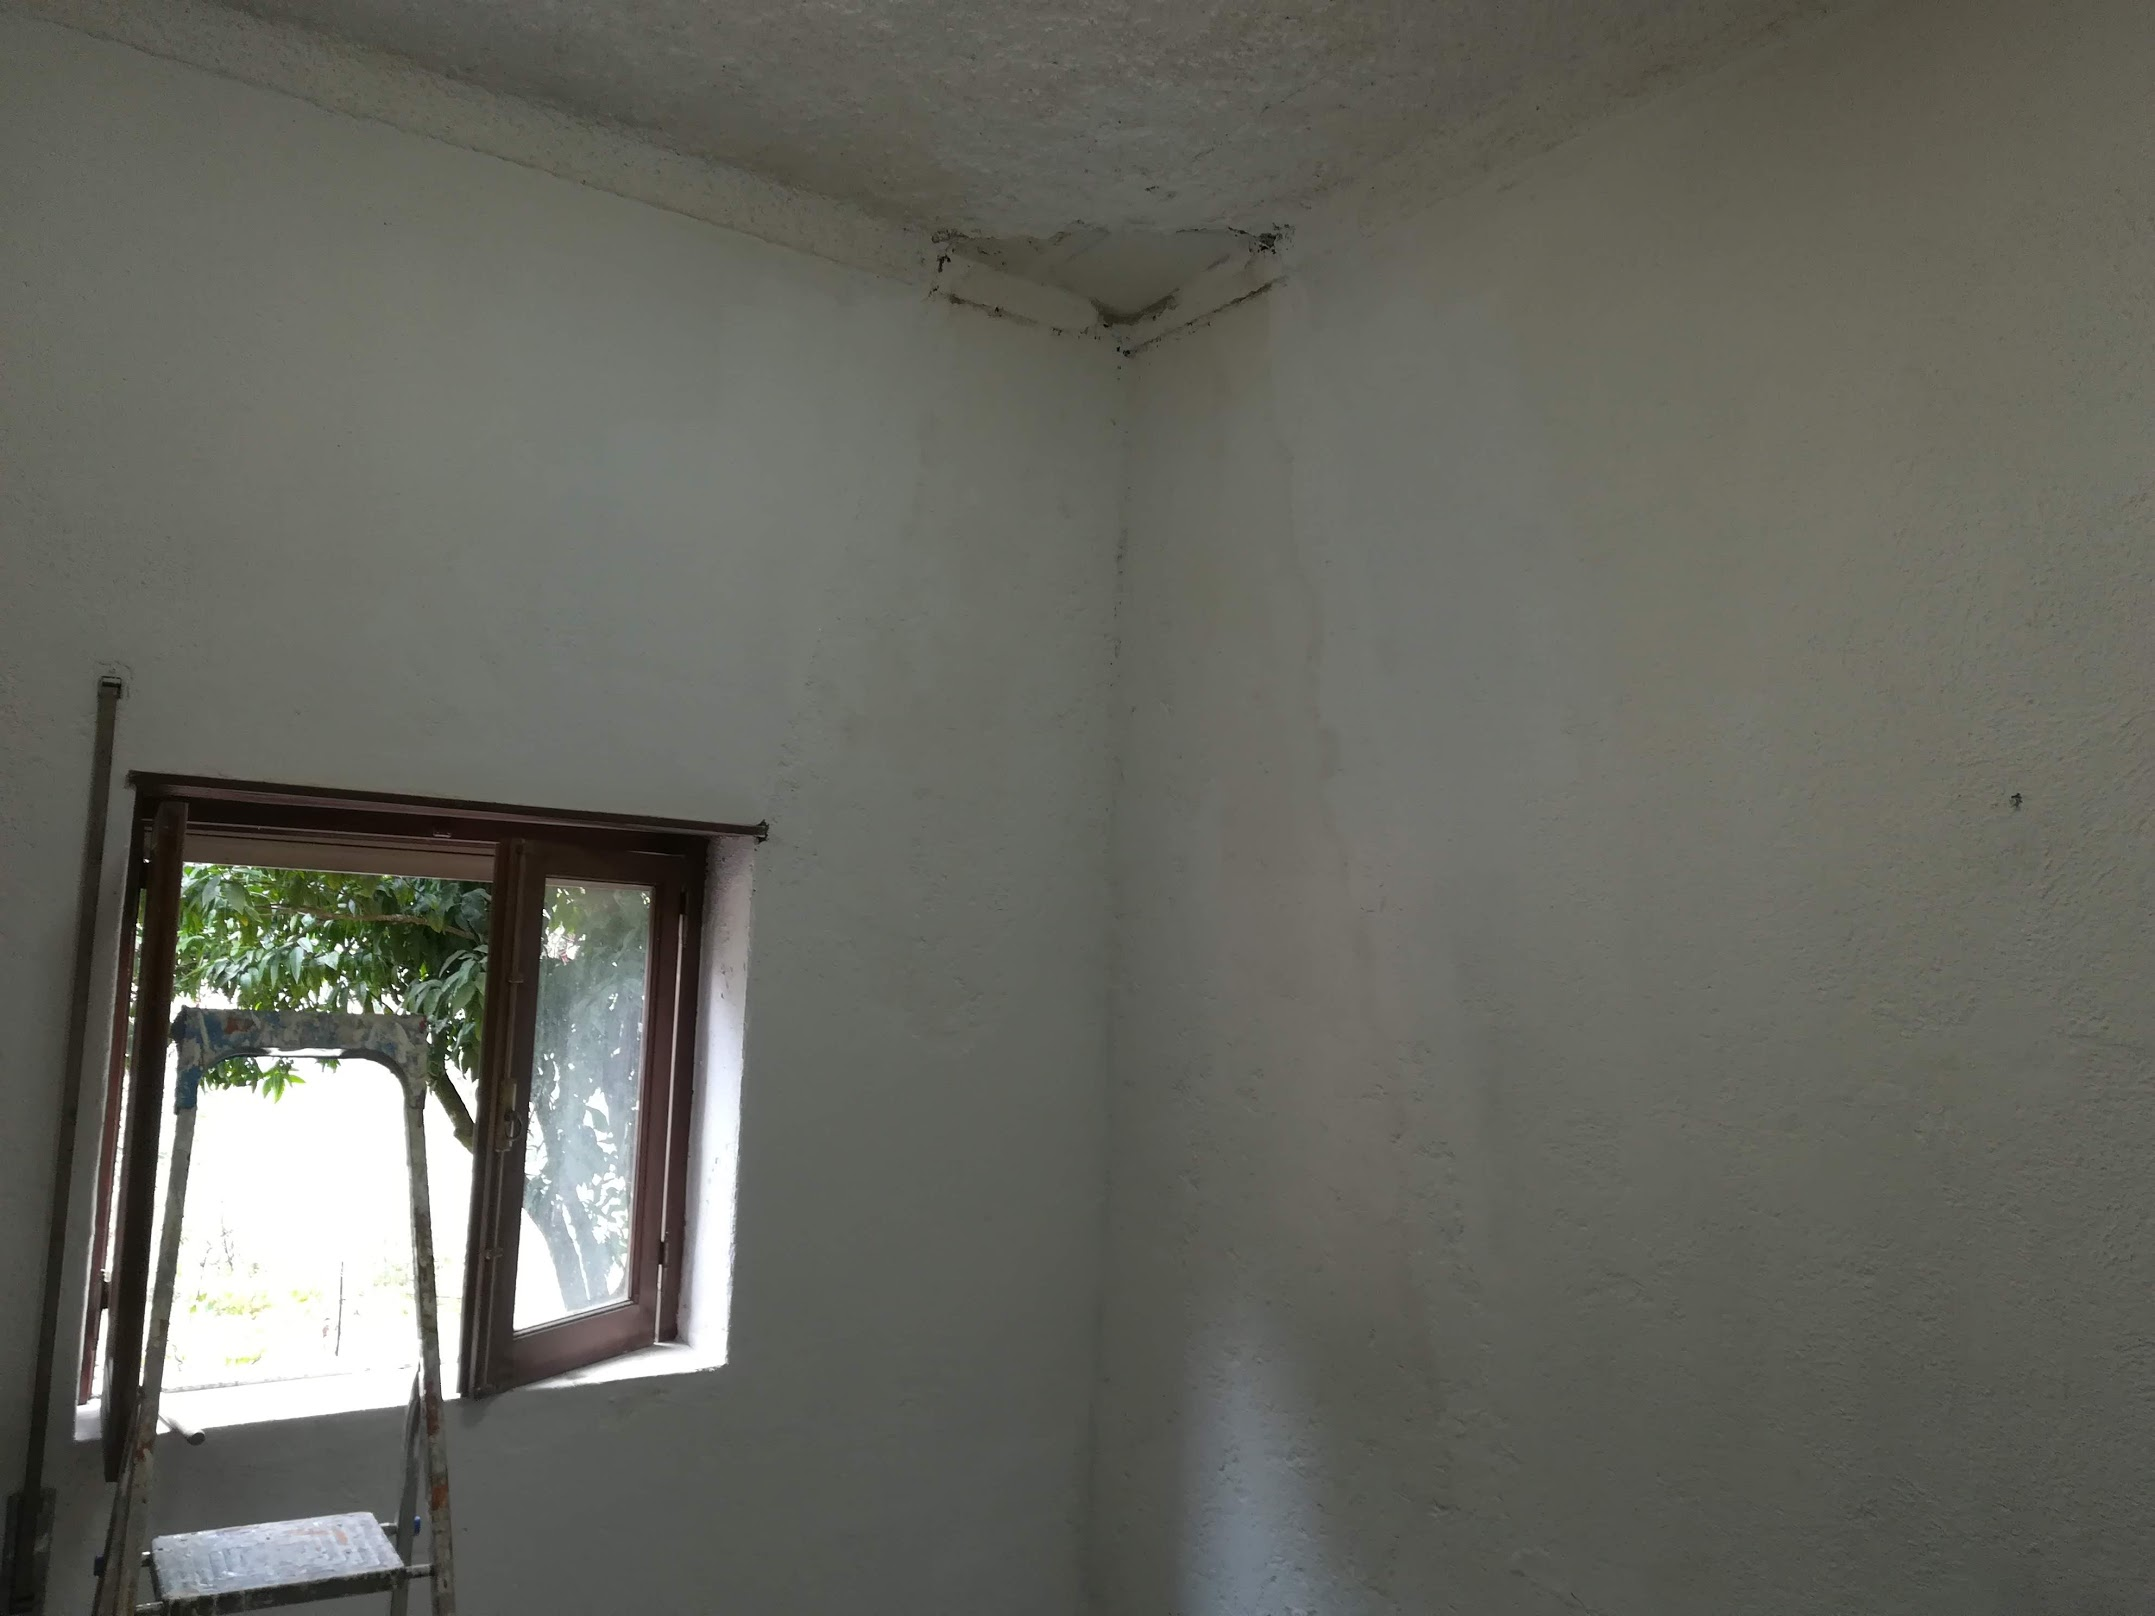
Here you can see it extended all the way up to the roof and was obvious from any angle. After the above photo was taken I turned my attention to the bathroom (as can be seen in my other posts) so neglected to take more photo’s of my progress in the kitchen.
I tried to optimise my time by running between the two, applying a coat of paint in the kitchen, then going back to do work in the bathroom, whilst the paint dried. I would then take lunch at some point, then paint another coat in the kitchen and go carry on with the work in the bathroom.
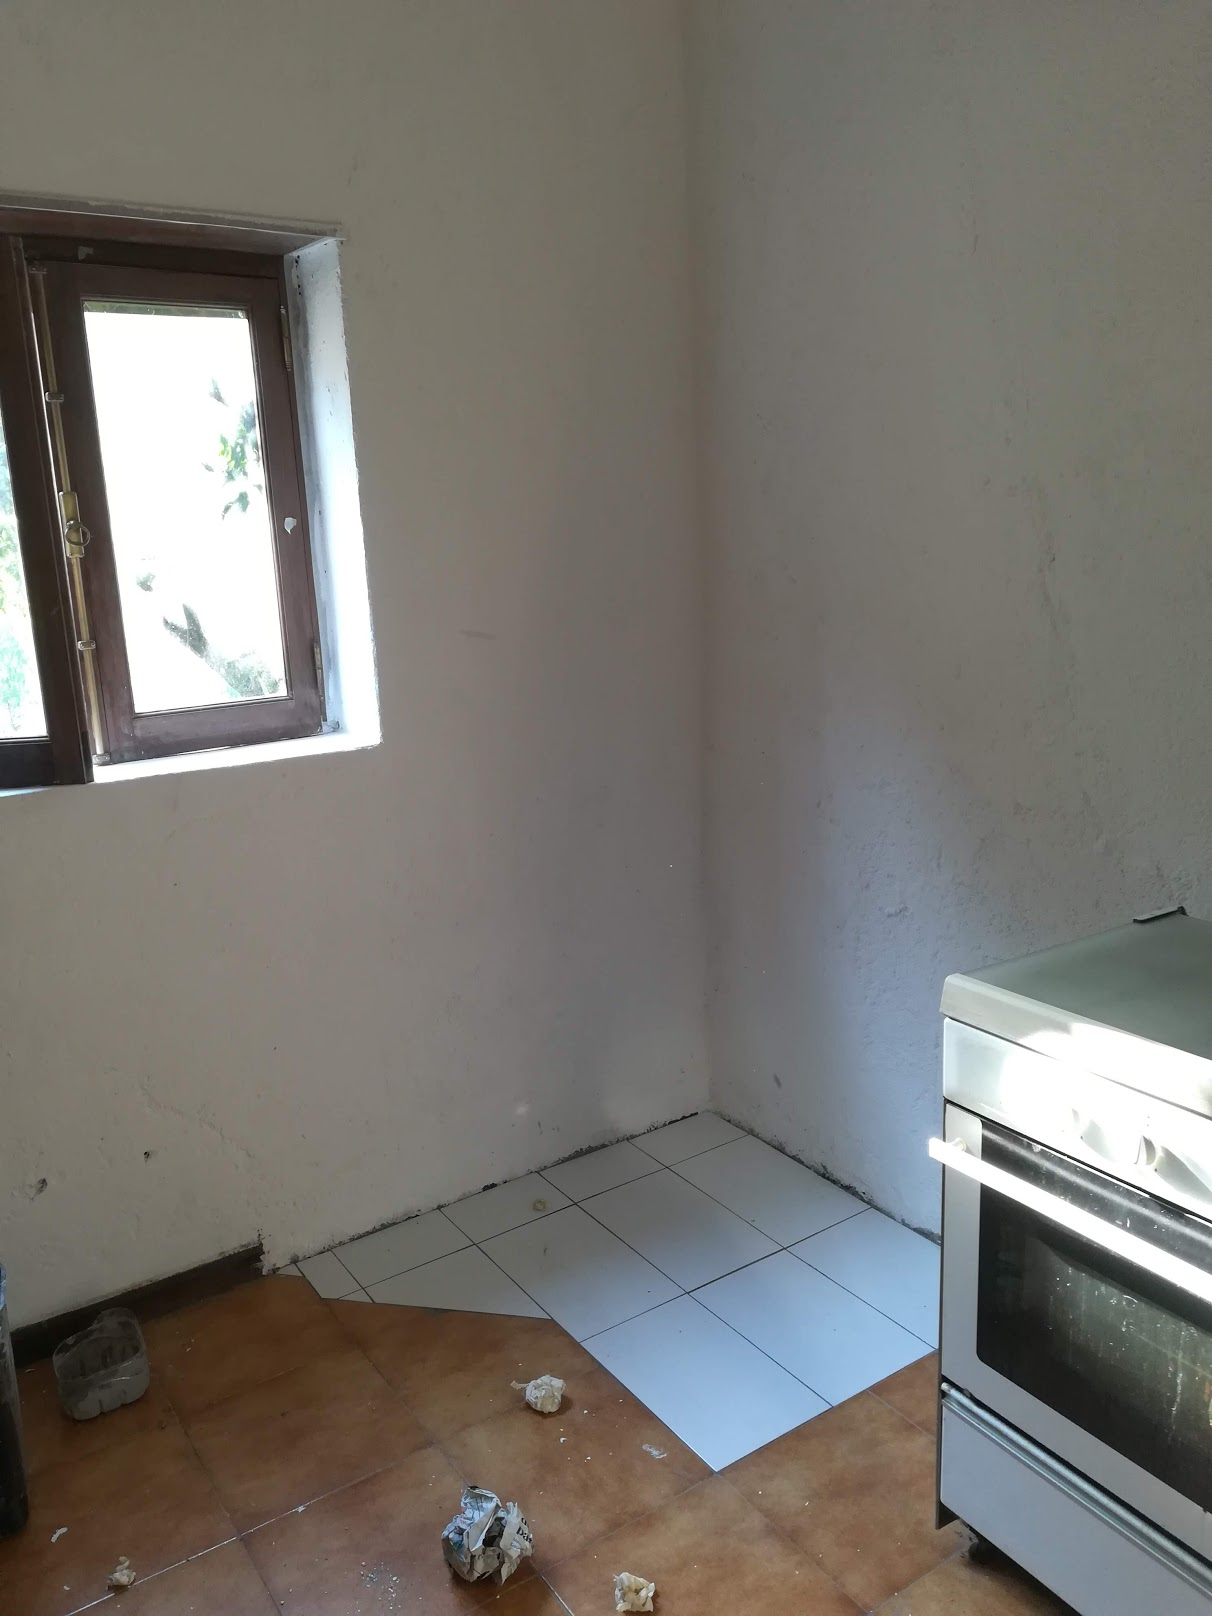
Skip forward to after having painted and tiled. Yes, those are a different colour, These are leftovers from the bathroom. I did try find similar tiles at the hardware store, but it’s nigh on impossible to match tiles that are years old with something in the store now.Most of the tiles would be covered by the cupboard and my mother-in-law is not a person who will blow up because tiles don’t match, thankfully.
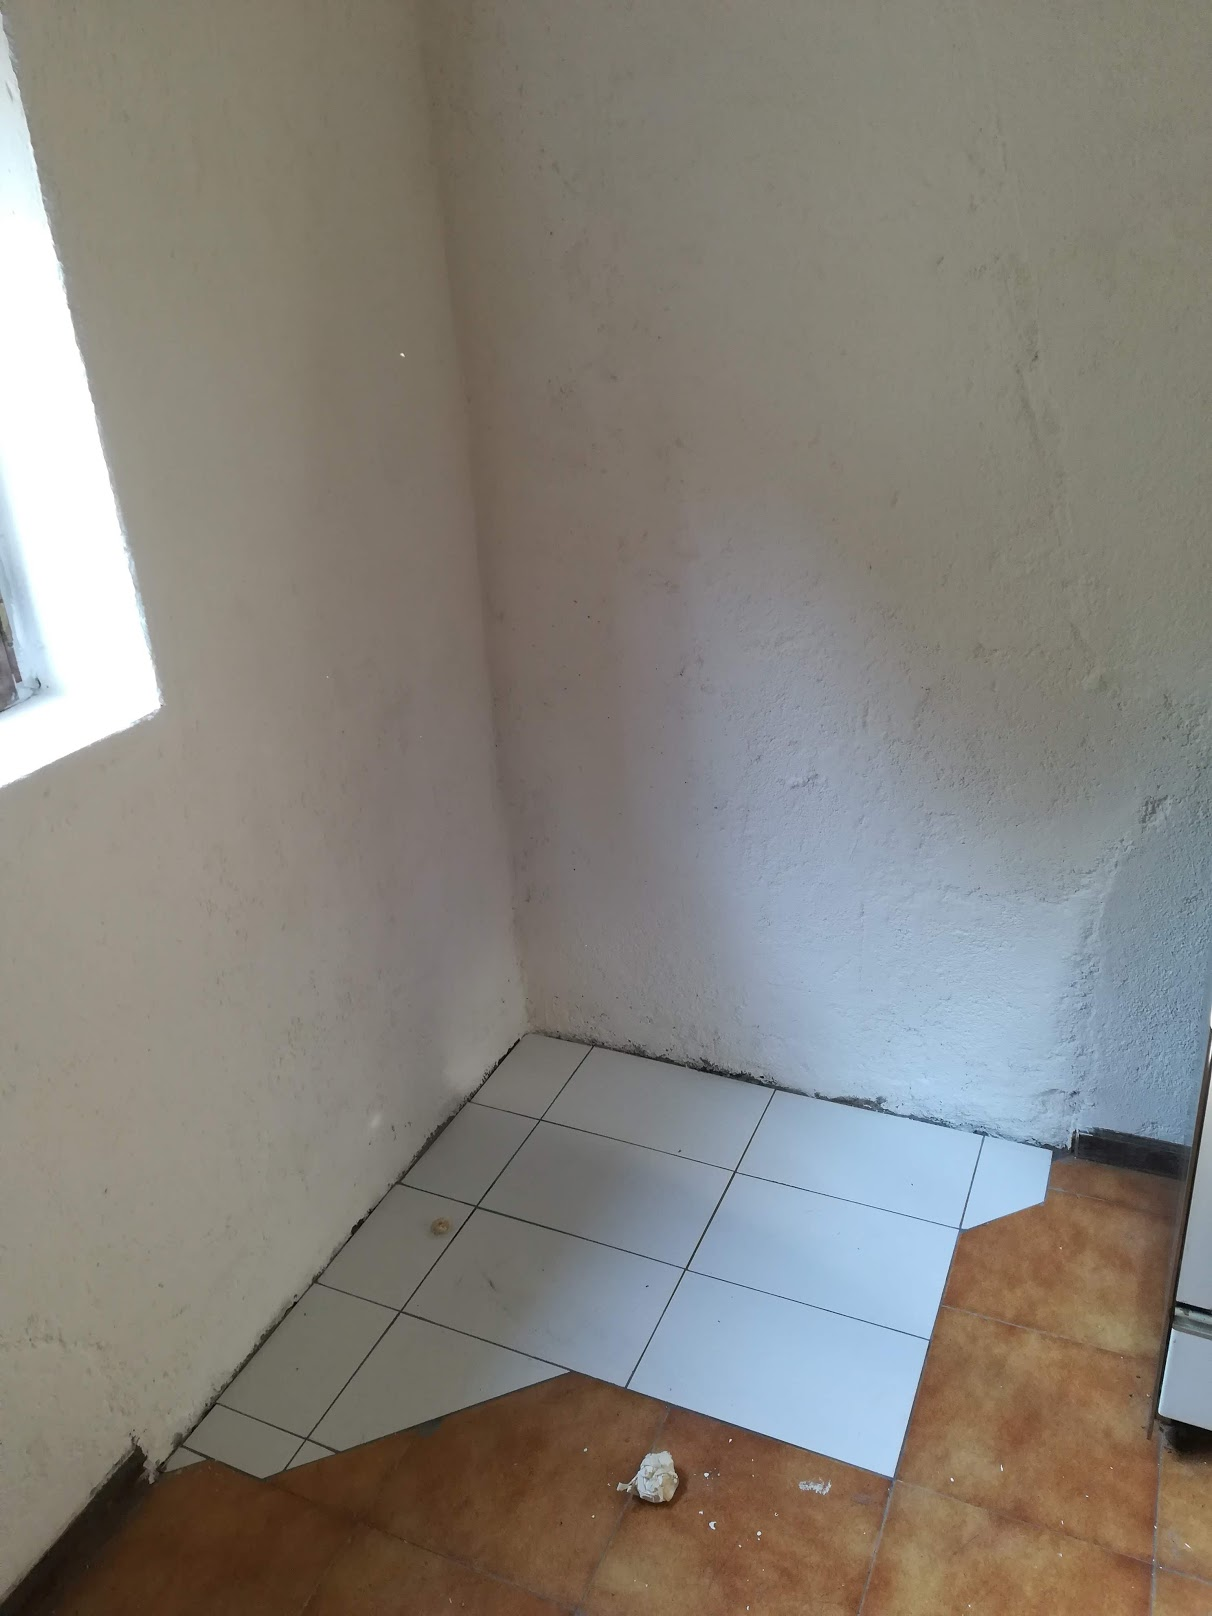
I tried to match the space as well as possible, given that the tiles were different sizes I tried to find the best compromise. It turned out ok I think.
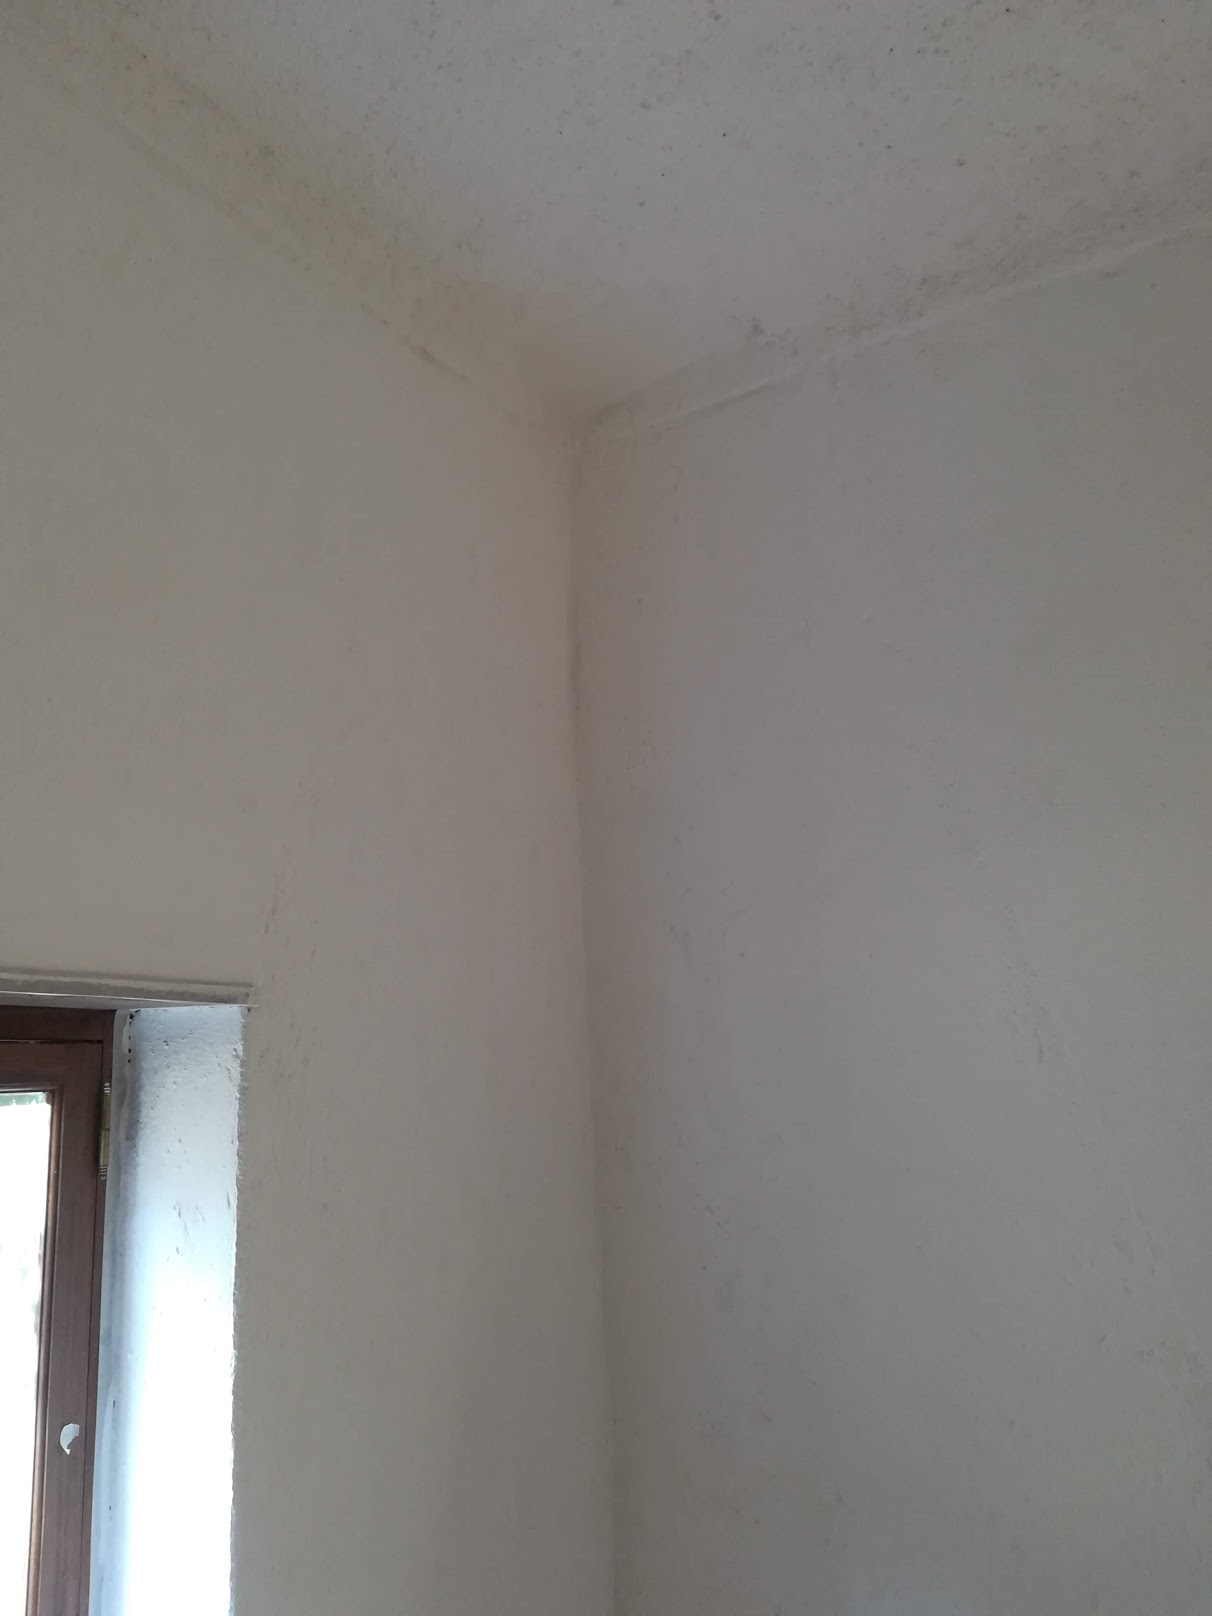
If you look hard enough you can still see parts where it is off-white. Thankfully standing in the kitchen it’s not nearly as obvious as in the pictures.
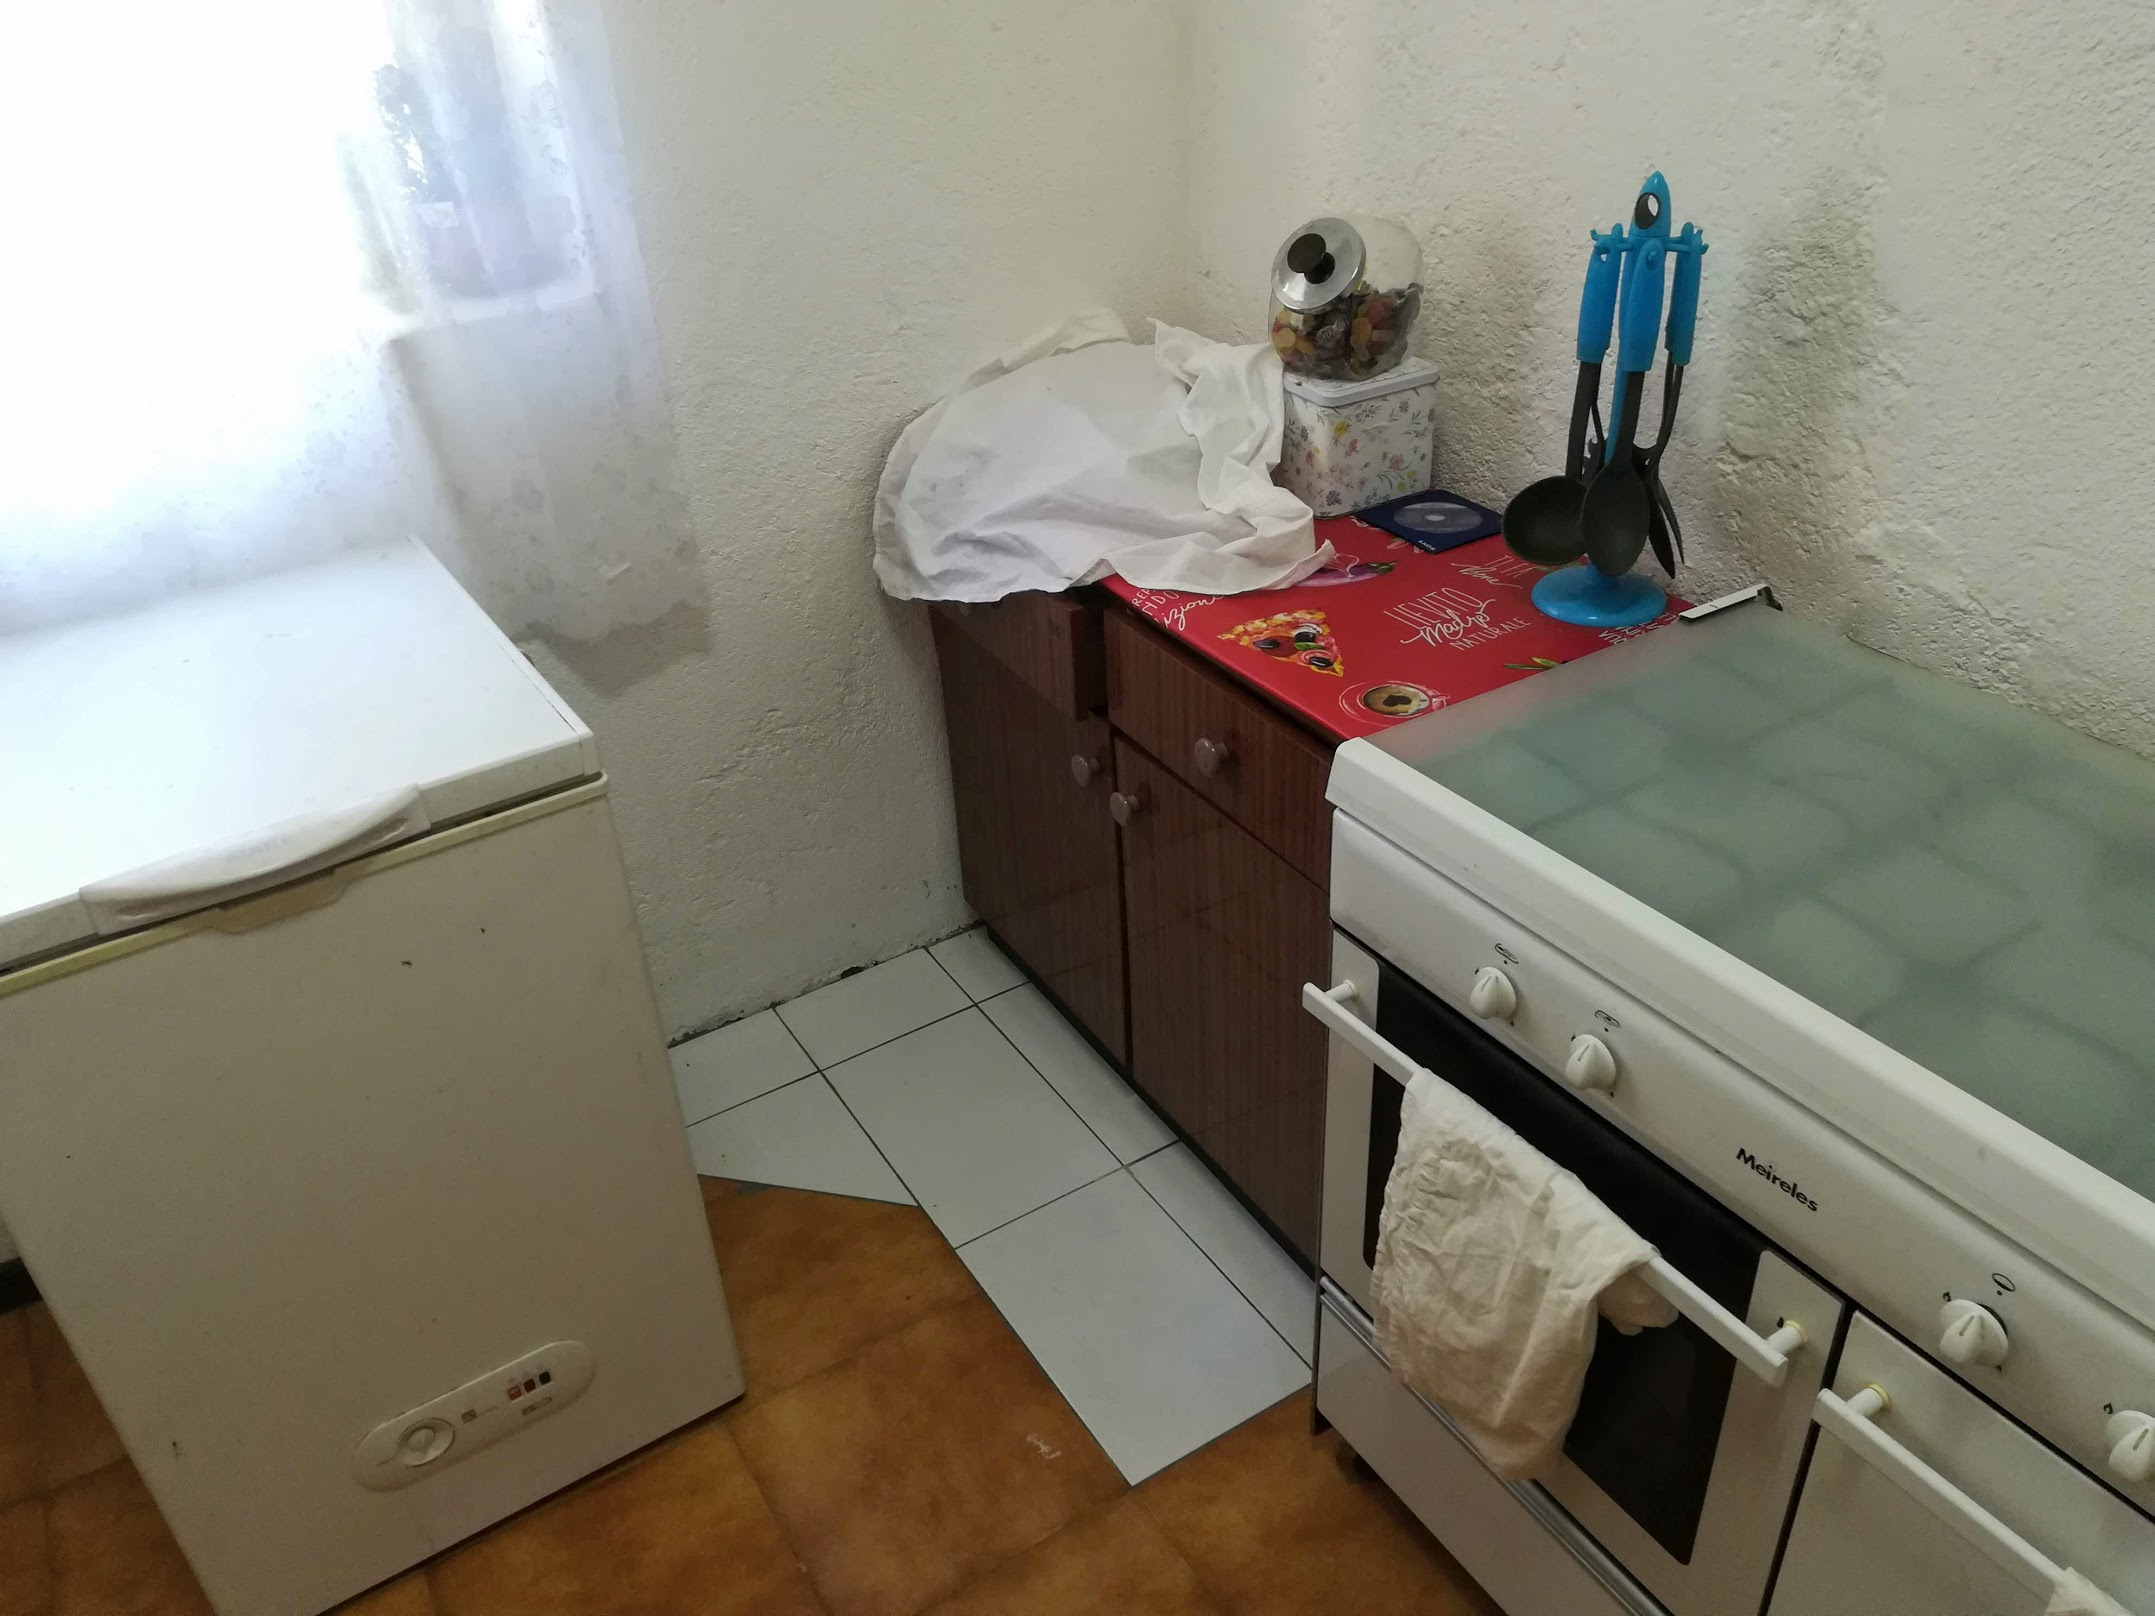
With some furniture in, its still noticeable, but not nearly as glaring as without.
Most important of all, my mother-in-law is happy with the result, this in turn makes my wife happy and you know what they say;
Happy wife happy life!

The market remains lacklustre, but relatively predictable. I’ve had more success with recent BTC price predictions than what I normally have – which gives me added confidence in my current buying strategy. This post explains that strategy.
It’s no secret that I have had BTC buy orders in the $8000s for a good few weeks now, if not months. I constantly check the charts and update my TA in order to ensure that my buy orders remain valid. At the moment, I am happy that they are set at the right prices. I will now explain why:
Firstly, take note that I have done away with my regular diagonal Fib levels for the time being. As the bullish price action drew to a close, so those levels started to lose their relevance. The nature of the current market correction is such that diagonal Fib levels no longer a reliable means of price prediction. Obviously this will change at a later date, but for now I find no value in using them.
I predicted a BTC reversal of fortunes and a price drop over the weekend (on Twitter and in the TIMM Trading Pits). That price reversal/drop occurred late on Friday.

Calling the price turnaround was not hard, the TA was pretty clear. What is still unclear for now, is whether BTC is in a bearish converging triangle or a negative channel. Fortunately this doesn’t matter much – as the outcomes of the two are fairly similar – at least for investors.
Below we can clearly see how BTC respected the top of the channel/triangle and became negative – a trend which should now continue for the remainder of the working week, possibly longer.

It could be that the top of my channel/triangle is not correct (because I have excluded short-term outlier candles), but thanks to the latest data, it looks as if making the top of such a channel/triangle less steep does not tie in with the observed price movement data. The upper limiting line which I have created ties in nicely with the bottom of the channel, i.e. it runs parallel to it, giving credence to my theory that what looks like a triangle may still be a channel.

Channel or not, we are seeing support at $9500 – giving credence to my theory that BTC may be in a triangle despite looking as if it is in a channel. Looking at the bigger picture, I see no reason why BTC can’t be in a triangle within a channel – which I now believe is actually the most likely state of affairs.
Upon reaching support at $9500, I believe there is a good chance that support will not hold (as indicated on the chart below). Perhaps I’m wrong and it will hold. Perhaps BTC will bounce back up to the top of the triangle, before turning negative again. Much like I said in my post a week ago, other indicators such as trading volume and various momentum indicators show that a positive breakout for BTC is very unlikely at this stage. What this means is: if BTC does not break downwards through the bottom of the triangle this time, then it will probably do so the next time it tests the $9500 support level.

Looking at the chart above in more detail, we can see a historical support level exists between roughly $8100 and $7500. Provided that BTC price does break lower, I expect this support level to arrest the drop in price. Should it fail to do so, then price should stop dropping when it reaches the bottom of the channel – roughly at $7000 (that price changes over time due to the downwards slope of the channel).
So where should an investor look for a buy point?
There is a risk that BTC hits the bottom of the triangle, and then bounces back upwards, never to return so low again. Chances of this happening are slight, but not negligible. For this reason it may be a good idea to buy at the turnaround point of $9500. I am making $9500 an “Optional Buy Point’ for myself.
If BTC price decline slows significantly as it approaches $9500, I will assume that it does not have the momentum to break through, and will set a buy order just North of $9500 to avoid missing out on the dip. This will not be a big order – perhaps about 20% of my allocated funds – because there is still a fair chance that price will drop lower later on.
However, if BTC approaches $9500 at speed, chances are that it will shatter the support there. In such a scenario I will not buy at $9500, instead I will wait to buy in the $8000s, as I have been for the last couple of months. Since there are no other meaningful support levels in the area, I will not buy in the low $9000s. If BTC does break downwards through $9500, it should hit the $8000s – which is where I will start buying (as indicated on the chart below).

“Buy Zone 1” is my main buying zone, it lies between $9000 and $8100. I plan to spend 60% of my allocated BTC buying funds there – with the option of spending more if it looks like BTC won’t go any lower than $8000. I have buy orders at around $8900, $8500 and $8200 – these vary as my local currency fluctuates against the dollar, so I have to adjust them from time to time. At $8100 we once again encounter historical support – so that is where I stop buying.
Should BTC break through that support, I will be ready to pick it up at prices of between $7400 and $7000. This is “Buy Zone 2”. $7000 is the bottom of the channel (at least for now). If BTC fails to reach Buy Zone 2, then I will spend all of my BTC buying funds as the price moves back upwards through “Buy Zone 1”.
I do not see a scenario where BTC will drop below $7000. Firstly, because $7000 is the bottom of the channel, but secondly (and probably more importantly), because BTC can’t drop below $7000 without breaking through the Long-term Base Trendline. (as seen below).

The Long-Term Base Trendline is four years old and well established. It is highly unlikely that BTC can remain below the level of this trendline for very long. As a side note: I believe this trendline to be a measure of BTC adoption as well as the baseline from which any rally is launched. Interestingly, if I’m right about that, it means that reaching the trendline indicates that there is no hype in the market at that time.
If BTC does break though the long-term trendline, it will become incredibly unstable and likely to bounce back fast and hard. It also means that I will be willing to place even more money into it – money I will rob from my normal fiat money savings accounts. Obviously this is risky and not something I would recommend for most people. I’m telling you what I will do under such circumstances, not what you should do.
This unlikely buying opportunity is labelled “Unlikely Buy Zone” on the chart below.

That rounds up my latest weekly look at BTC. As for the rest of the market: altcoins remain in decline – providing excellent buying opportunities for shrewd investors who are willing to do their homework. In the bigger picture, I watched in amazement late last week at how money floods out of stores of value and back into the fiat-based markets on the slightest little whiff of optimism wrt US/China trade talks. They’re not even building a house of cards anymore, they’re building a house of rice paper. And it’s starting to rain…
All charts made by Bit Brain with TradingView

“The secret to success: find out where people are going and get there first”
~ Mark Twain
“Crypto does not require institutional investment to succeed; institutions require crypto investments to remain successful”
~ Bit Brain





